Triangle Patterns – Technical Analysis
It shows how the price moves into a smaller and smaller range over time and depicts the clash between the bears and the bulls.


What Are Triangle Patterns?
In technical analysis, a triangle chart pattern shows how the price moves into a smaller and smaller range over time and depicts the clash between the bears and the bulls.
The pattern is frequently referred to as a "continuation pattern," which means that it is commonly believed that the price will continue to move in the direction of the trend in which it was before the pattern was formed.
These are patterns that traders can frequently spot when the trading range of a stock price narrows after an uptrend or a downtrend.
These patterns can help predict either a continuation of the prior trend or a reversal, unlike other chart patterns that provide a definite directionality to the impending price movements.
Since triangles more often indicate that the current trend will continue, traders should wait for a breakout of the triangle before entering any trade long or short. Triangle patterns are a common sight in the forex markets.
These patterns give traders more knowledge about upcoming price movements and the potential continuation of the present trend. It is crucial to comprehend each triangle pattern separately because not all forms can be read similarly.
In the middle of a trend, a triangle pattern is a consolidation pattern that typically denotes the continuance of the current trend. For example, drawing two converging trend lines as the price briefly moves sideways creates a triangle chart pattern.
Traders sometimes use the following breakout in the direction of the previous trend as a cue to place a trade.
Of course, there will be a period of trial and error and setbacks along the way. Nevertheless, it's important to persevere and keep enhancing the best techniques that work for you.
Therefore, understanding the chart formations and indications is essential for creating a successful trading strategy, helping traders accelerate their journey to success. But, above all, understanding these patterns is highly beneficial.
When day trading in cryptocurrencies, foreign exchange, or equities, it's very helpful to build breakout or anticipation methods since it gives traders a complete picture of the real risk and potential reward in a trade.
Aside from that, compared to other chart patterns, these patterns frequently offer reduced volatile entries.
- When traded in the direction of the market's current trend, symmetrical triangles offer the best returns.
- Before the consolidation period, keep track of the trend's direction at all times.
- Use the upper and lower trendlines to determine the type of pattern that is forming.
- Like the Ascending and Descending Triangle patterns, the Symmetrical Triangle is a continuation chart pattern.
- The creation of the triangles is seen as a continuation chart pattern, which indicates that the previous trend will carry on after this chart pattern has been formed.
- The upper line of descending triangle chart patterns comprises a series of lower highs.
- Regular falling triangle patterns are typically viewed as bearish chart patterns. A falling triangle pattern can, however, also signal a bullish trend.
- Unlike the symmetrical triangle, an ascending triangle has a clear bullish bias before the breakout.
Types of Triangle Patterns
This pattern appears when a stock's trading range shrinks following an uptrend or downtrend; this pattern might signal a consolidation, accumulation, or distribution before a continuation or reversal, depending upon the type of triangle formed.
These chart patterns comprise multiple candlesticks surrounded by two converging support and resistance lines. The two convergent lines depict the outline of a triangle.
Since it is possible to utilize these patterns to determine whether a market will continue to be bullish or bearish, they are important.
Bitcoin and other cryptocurrencies are frequently mentioned in the news due to their erratic nature and quick rises and falls. However, even a 20x increase in less than a year is not that much of a shock in the world of cryptocurrencies.
These patterns frequently serve as a precursor to extremely volatile movements, as the price gets squeezed within a range, and when it exits that range, the price increases rapidly.
These patterns are reasonably possible, especially when employed as a continuation of the dominating trend at the time. Consequently, the trendline and a convergent price range may be advantageous to traders.
Knowing that false breakouts frequently occur in triangle patterns is crucial, as is being mentally ready for them. Other patterns, such as the Wedge or Flag, have a similar appearance; one should be able to spot the difference.
Even though patterns in theory and a book look too perfect, that may not be the case. It is all about the price action that the pattern is forming, and we need to exploit the opportunity that comes along with it.
Before a breakout, do make sure the pattern touches the border lines at least twice. This is crucial because, if it does not, then it does not verify as a good pattern and ends up being a false signal.
When the price oscillates between the two trend lines, triangular formations are viable.
There shouldn't be many empty spaces in the price formation, which means that before a breakout, the price shouldn't meander and constantly touch a boundary. The price formation must have at least two separate minor highs and minor lows.
Usually, the volume decreases just before a breakout. Learn to recognize behavior patterns and keep an eye out for any odd developments.
The minimum expected move following a breakout is equal to the height of the formation at the beginning of the triangle. If the breakout is unsuccessful and extends past the opposite boundary of the triangle, immediately exit with a loss.
If you join the trend in the opposite direction as the initial trade, a busted pattern can also offer you significant profit potential.
Triangle patterns generally are of three types: symmetrical, ascending, and descending. Despite their distinct differences, all three sorts of triangles have similar meanings.
Using Symmetrical Triangle Patterns
Price patterns called symmetrical triangles have support and resistance lines that slope and converge in the same direction. However, while the support line climbs upward from the bottom, the resistance line descends downward from the top.
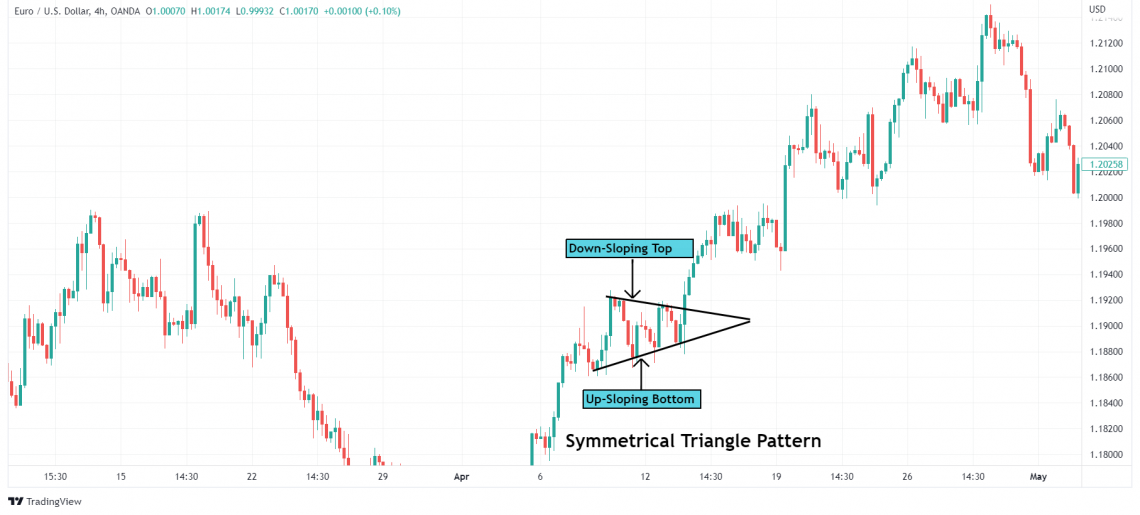
As this formation takes shape, the market is making lower highs and higher lows.
The price is not being pushed by either the buyers or the sellers far enough to establish a definite trend.
If buyers and sellers were engaged in tough competition, the outcome would be a tie. This is a sort of consolidation of the price. Although they can signal trend reversals, they typically lead to the continuation of the existing trend.
Like the other triangle formations, it is crucial to have at least two minor highs and lows. It would be better to count the separate touches to ensure that the pattern is genuine. During the pattern's development, the volume usually recedes.
The figure above shows buyers and sellers could not move the price in their favor. As a result, we experience higher lows and lower highs when this occurs.
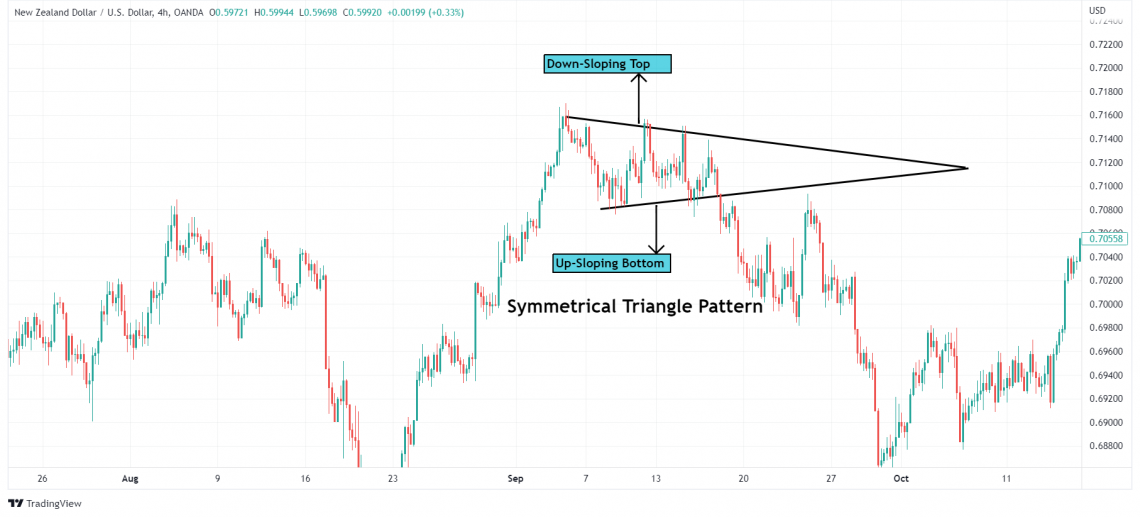
In the above chart, the symmetrical triangle pattern fails, giving us a great reversal trade.
A convergence of the two lines indicates that a breakout is about to occur, and although the breakout's path is unknown, we know that the market will most likely move in that direction. One side of the market will eventually yield a profit.
Trading symmetrical triangles in the direction of the market's current trend—trading upward breakouts in a bull market and downward breakouts in a bear market—results in the best profits.
It's critical to remember that obtaining a perfectly symmetrical triangle is incredibly rare, so traders shouldn't be fast to rule out faulty formations.
Triangle analysis is more about understanding what the market is saying through price movement than identifying the ideal pattern, as traders should be aware.
Using the Ascending Triangle Pattern
Unlike the lower trendline of the symmetrical triangle, which is rising, the upper trendline of the ascending triangle pattern is flat.
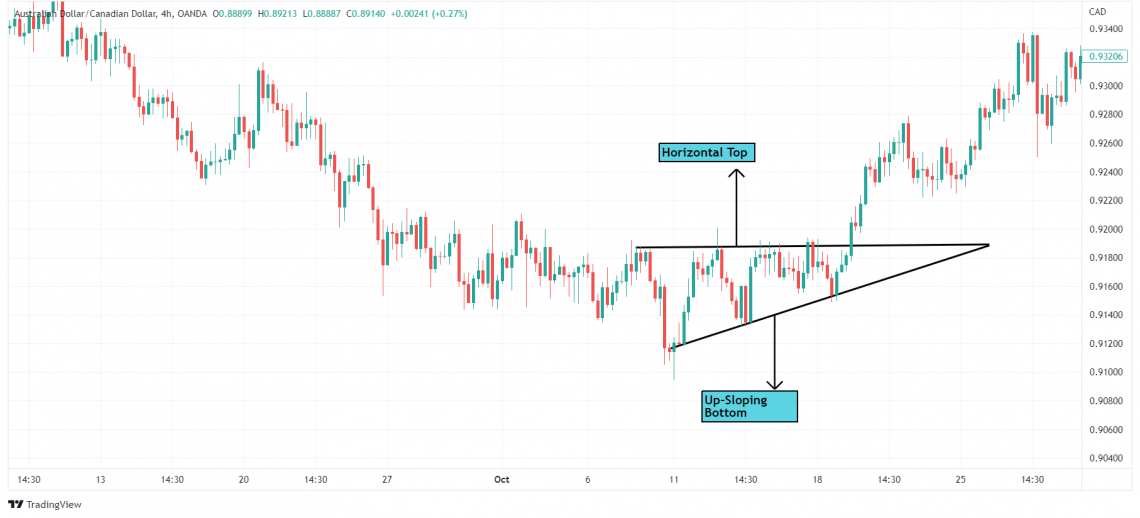
Ascending triangles are price action patterns with a horizontal top and a bottom that slopes upwards. For example, a breakout might be breached by the increasing slope on the downside or the horizontal barrier on the upside.
Since it was created during an uptrend, the price rise would likely continue. Though the ascending triangle is generally formed in an uptrend, it may also form at the end of a downtrend. This usually indicates the end of the downtrend.
It has a right-angled triangle shape with resistance and a slope of higher lows.
The AUD/CAD chart above shows a rising triangle. The ascending triangle results from a consolidation phase that follows the current decline. Once more, traders can calculate the vertical distance at the start of the triangle formation and use it to predict the take profit level at the breakout.
This pattern demonstrates unequivocally that the market rises as higher lows are made in the direction of the resistance line.
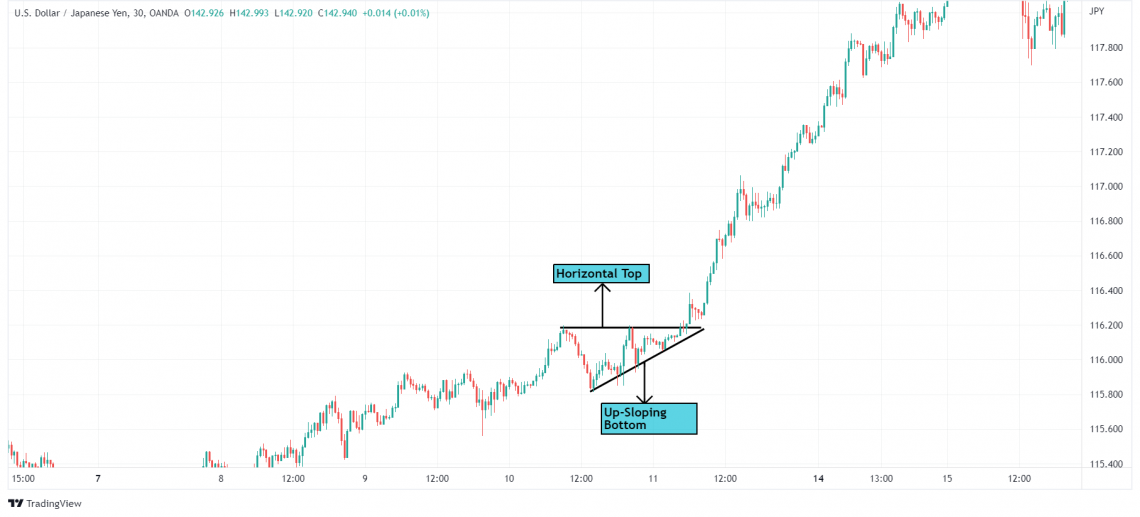
This demonstrates the power of bulls, who are prepared to pay more for the stock. When the prices break through the resistance level with high volume and continue to rise, this signals a successful breakout.
Unlike the symmetrical triangle, an ascending triangle has a clear bullish bias before the breakout. Remember that the symmetrical triangle is a neutral formation that depends on the approaching breakout to determine the course of the subsequent move.
The horizontal line on the ascending triangle denotes the overhead supply that limits the securities' ability to rise over a specific level.
It appears as though a sizable sell order has been placed at this level and is being executed slowly over days or weeks, preventing the price from increasing further.
The volume declines as the price repeatedly swing between the resistance and the support. The pattern is considered genuine only if the price forms two distinct minor highs before breaking.
Before moving outside the trendlines, the price action must fill the body inside the trendline; it should not travel along just one trendline.
Using Descending Triangle Patterns
Descending triangles are a bearish pattern where the price structure should include a flat support line and a falling top; breakouts can occur either upward or downward. At the same time, a negative breakout during a bad market might lead to significant gains.
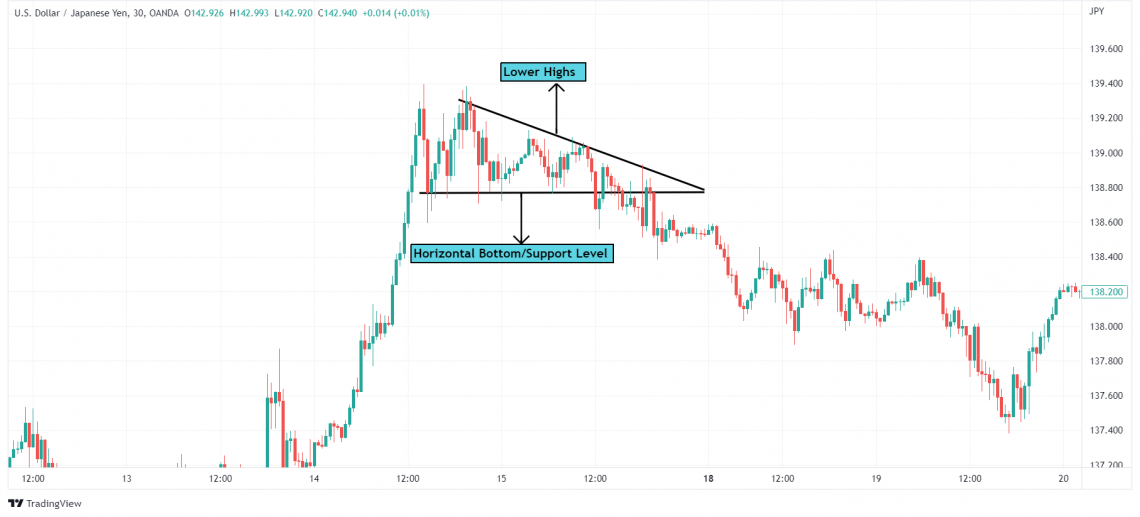
Contrary to what many believe, a descending triangle can be bullish or bearish. Regular falling patterns are typically viewed as bearish chart patterns. A falling triangle pattern can, however, also signal a bullish trend.
It is referred to as a reversal pattern in that case, and a reversal pattern is generally formed at the end of the prior trend.
The descending triangle, which forms during a decline, signals the continuance of the downtrend.
It is shaped like a downward-sloping triangle with support and a slope of lower highs. The support prevents further declines in security prices.
The lower highs indicate that there is more selling pressure today. This pattern shows that the market is moving lower as lower highs are set toward the support line.
Volume is not a crucial benchmark because it typically follows a reversing pattern from the formation's beginning. Before the breakout, the volume will often be quite low before exploding during the subsequent activity.
The upper line of descending triangle chart patterns comprises a series of lower highs. The bottom line serves as a level of support that the price cannot breach.
Now, the price usually breaks the support line eventually and keeps falling.
But occasionally, the support line can be too strong, causing the price to bounce off and surge upward.
Here is a good illustration of a descending pattern on the USD/CAD chart. A downturn ushers in the consolidation phase, during which sellers outnumber buyers and prices gradually decline.
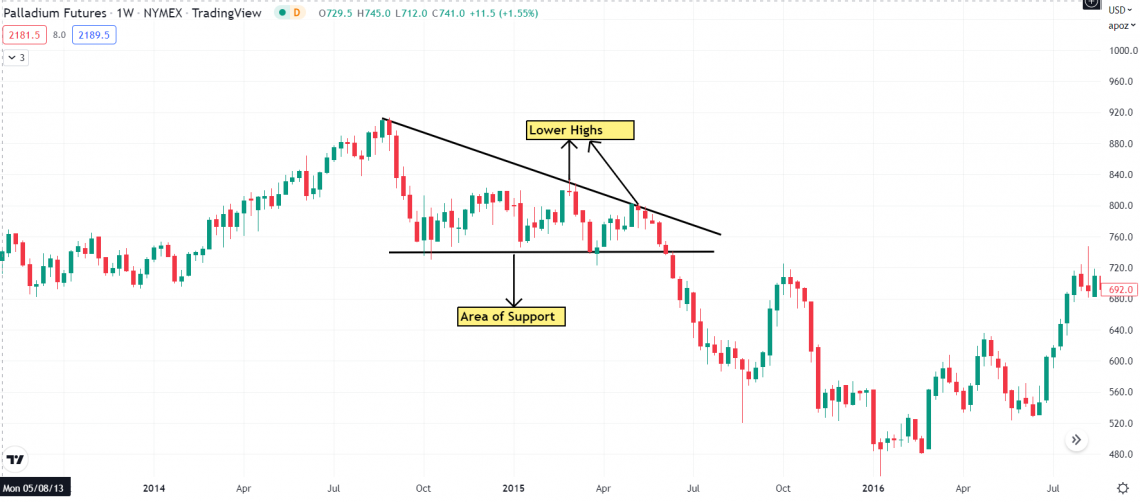
The lower trendline must be broken decisively for traders to take a short position. In this pattern, prices frequently fall to the exact location and bounce again, but the bounce height is lower than the previous price each time.
Volume is not a crucial benchmark because it typically follows a reversing pattern from the formation's beginning. Before the breakout, the volume will often be quite low before exploding during the subsequent activity.
As was mentioned during the ascending triangles, a breakout should not be disregarded based solely on volume activity. On modest volumes, effective breakouts also frequently occur.
The breakout could potentially take place before the point where the support and resistance lines converge, much like ascending triangles.


or Want to Sign up with your social account?