Volume Analysis
Analysis of the overall volume of securities traded during a specific time.
Trading has become a sophisticated act. Today, many trading instruments are available for traders and investors to utilize and exchange to gain long-term or short-term benefits.

Trading has created many elements that can be used to enable parties involved to make sound decisions.
For traders, many tools and indicators can be used to determine the trend of a particular security.
Tools of such nature have developed with time, some have existed for a while, and traders have newly adopted others. Either way, there are some essential tools and indicators.
Trading relies on information and instant decisions taken by traders. These decisions are not based on sheer luck; for many professional traders, they are based on facts and accurate calculations that give them a possible outcome.
Sometimes traders make decisions based on facts and calculations to ensure profitability and control losses and impacts of wrong choices. Hence, some tools and indicators could be used for either of these purposes and needs.

This tool can be volume.
Volume is one of these indicators that have existed for almost four decades to enable traders to indicate outcomes of masses regarding a specific commodity, product, company, or simply a stock being traded in the stock market.
But what is volume, and what can be gained from understanding it?
What is volume?
Analysis of the overall volume of securities traded during a specific time is called volume analysis. They could be contracts or shares of any particular security.
Technical analysts view trade volume as one of the key indicators of the likelihood that a certain trading choice will be successful.

By examining both volume and price patterns, investors can determine the extent to which changes in the price of security impact the return. Simply said, volume is the total number of contracts traded in a certain period, often daily.
Volume analysis is frequently employed by analysts who study equities in the financial markets.
Financial analysts need to be able to recognize and identify volume trends, particularly because figures regarding the trading volume of the entire market, as opposed to the trading volume of a single holding, might indicate various market characteristics.
All forms of analysts who monitor particular securities on the financial markets perform volume analysis. Volume often refers to the total number of shares traded each day.
One crucial contrast that aids analysts in identifying volume trends are knowing the entire market's trading volume compared to the volume of a single holding.
High trade volumes frequently reveal a lot about the investors' perspectives on a market or security. For instance, a convincing indicator of a continuing bullish trend or a reversal could be a substantial price gain accompanied by a significant volume increase.
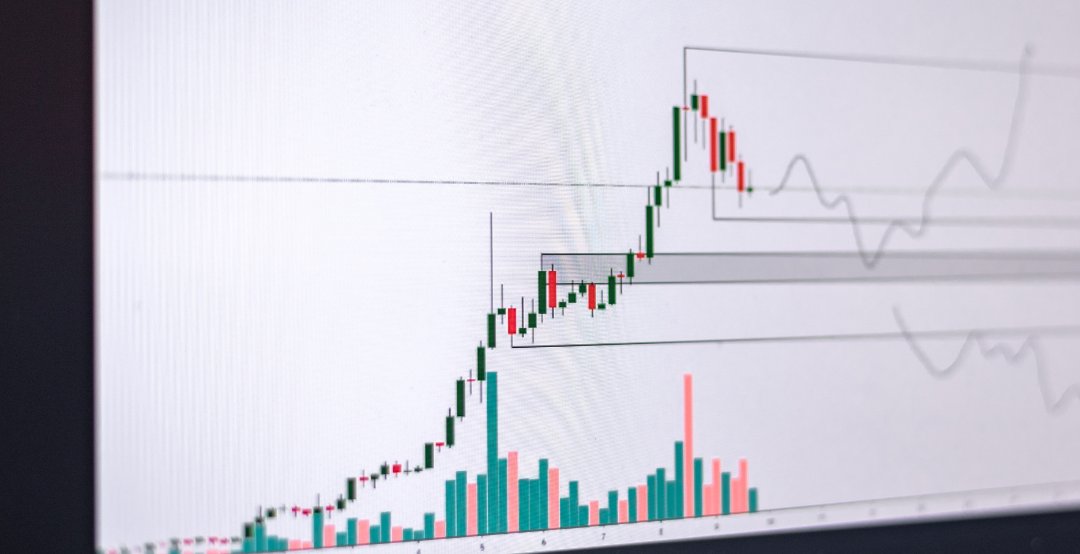
On the other hand, a substantial price decline accompanied by a significant volume rise may indicate a negative trend continuation or reversal. Therefore, technical analysts should generally include volume charts in daily charting diagrams.
Usually, volume charts are accessible beneath a typical candlestick graph. In most cases, these charts will also show trendlines for moving averages.
When making a trading decision, an investor can benefit from having a better-balanced understanding of all the major market elements that can affect a share's price. This allows the investor to make a more well-informed choice.
What does it mean when volume changes?
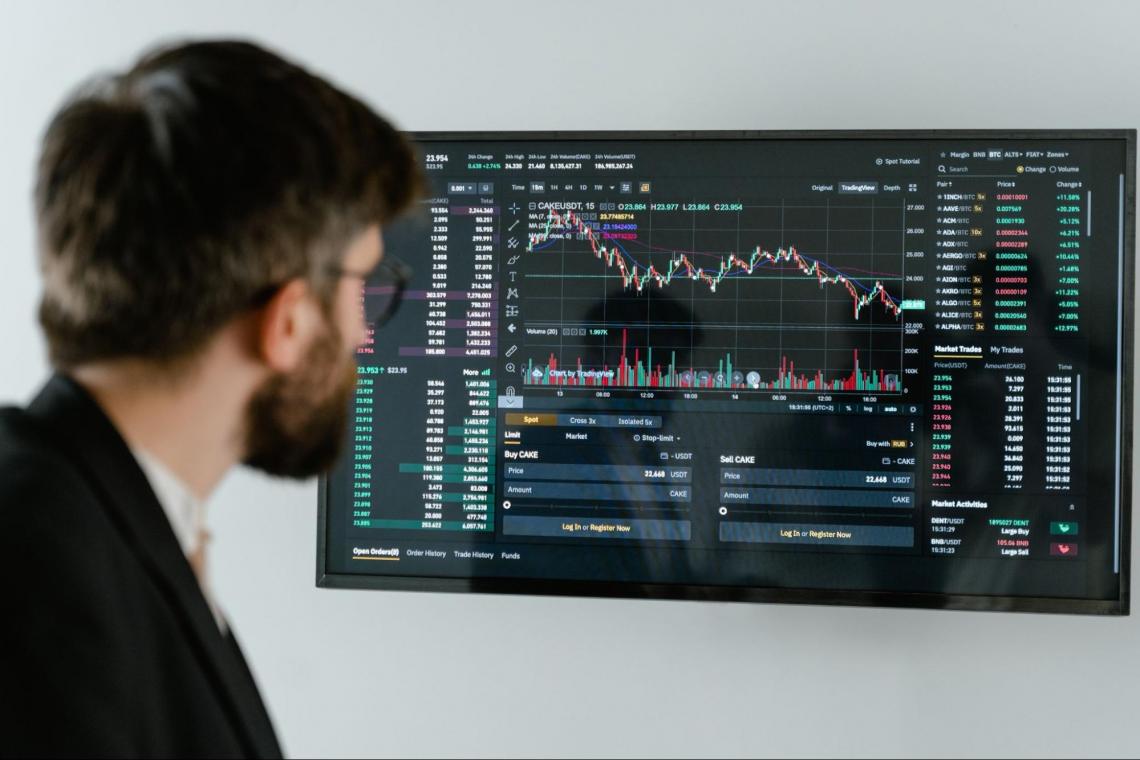
Changes in volume can signify many things, allowing traders to understand trends that have occurred or will occur. Either way, any change in volume does mean something which can be of great value to traders. Some of the trends linked to volume change are:
a) Trend confirmation
Volume data plays a crucial role in trend confirmation. Typically, an increasing volume indicates a rising market.
Buyers must have high expectations to keep driving prices up. Such an increase in buyer enthusiasm may be caused by increasing volumes of data.
A price increase alone cannot be regarded as a reliable indicator of investor confidence. But when combined with substantial trade volumes, it strongly suggests that investor sentiment is upbeat.
Prices were rising while trading volume falls could signal a lack of investor interest in the markets, which could cause booms to reverse.
b) Bullish signs
Volume can be utilized to spot bullish market indicators. Think about a scenario where volume increases but prices decrease. Then, prices rise as a result of the occurrence before falling again.
c) Price reversal
Consider a scenario in which a security's price has steadily increased or decreased over an extended period. When prices fluctuate in small increments and trade volume is high, it is typically interpreted as an indication that prices will soon reverse.
d) Volume and breakouts
A breakout occurs when market patterns alter. The volume can accurately gauge the strength of an early breakout from a trend in market movements, such as a range or other chart patterns.
e) Liquidity
In any market, volume is a crucial measure of liquidity. High trading activity in a market indicates that many buyers and sellers are willing to transact. Trading becomes incredibly liquid and appealing in the short term as a result.
Types of volume

1. Buying volume
Because more traders are present in the market and ready to fill the other side of your trade, buying and selling large or small volumes of stock will be simpler when the trading volume is higher.
In any transaction, there must be a buyer and a seller. So, for example, if you want to buy a stock, a seller must sell it to you, and if you're going to sell it, a buyer must purchase it from you. So as a result, it cannot be obvious to hear expressions like:
- "Sellers are in charge."
- "The amount of purchases exceeds the number of sales."
- "The volume of purchases is high today."
- "When the price is forced upward, buyers are in charge."
- "At the offer price, buy volume occurs."
- "It stands for the lowest publicized price that sellers will sell their shares for."
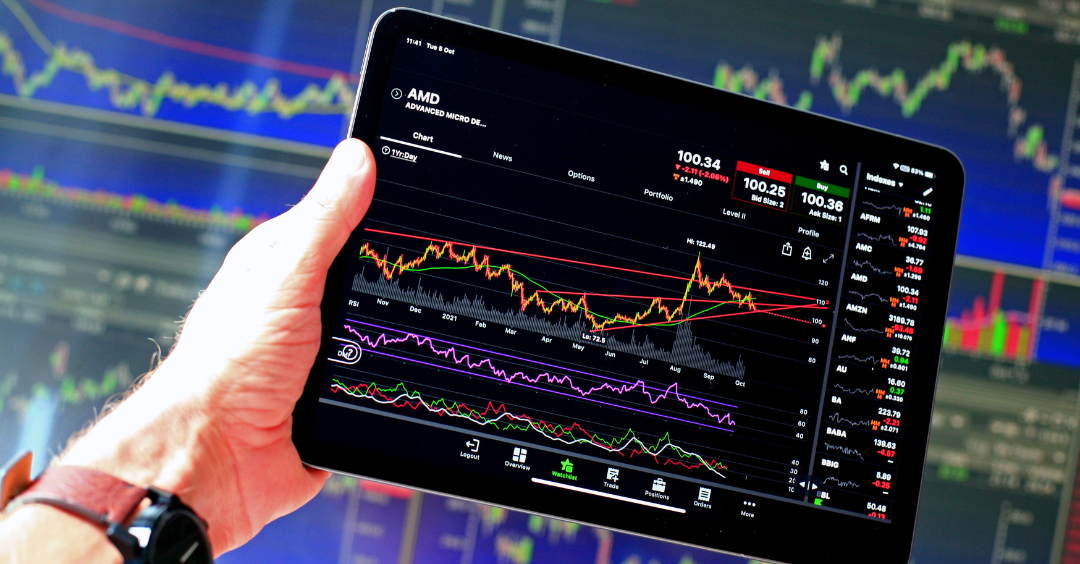
You'll find buying easier when trade volume is larger, and buyers have control when the price is forced higher. At the price of the offer, buy volume occurs. It is the lowest stated price that sellers are willing to accept for their shares.
When shares are purchased at the current offer price, it indicates that a buyer is interested in the stock and counts toward the buying volume metric.
2. Selling volume
When the price is driven lower, sellers have more power. There is a selling volume at the bid price. The bid is the highest publicized price that purchasers would offer.
A stock price chart's bottom usually displays volume. Charts illustrate trade volume as vertical bars, with each bar representing the number of shares that changed hands over a specific time.
Colored volume bars are possible. A red volume bar indicates that the price dropped during that time, and the market views such volume as selling activity (estimated). When the volume displays a green bar, the market interprets this as buying volume because the price increased during that time (estimated).
3. Relative volume
Traders prefer trading stocks with high volume because it enables speedy entry and exit into and out of positions, whether large or small. The average volume figure reveals how many shares are traded on an average trading day.

Day traders frequently choose stocks or exchange-traded funds (ETFs) with high average volumes and those with very high volumes on specific days. Conversely, a lower-than-average volume on that particular day indicates less activity in the stock and probably smaller price changes.
4. Higher Volume
Watch out for days with higher-than-normal volume. Such days frequently feature high levels of volatility and price swings. For example, the price will decrease if most of the volume is traded at the asking price, and the higher volume indicates that sellers are eager to unload the shares.
The stock price will increase if the majority of the volume is at the asking price (due to demand and price availability). The higher volume demonstrates that investors want to buy the stock and believe it is moving.
Increased volume often indicates that the stock has seen some change. Usually, a news item or active traders who have suddenly become anxious or ecstatic about the possibilities of the stock affect volume trading.
Analyzing stock price movement & pullbacks
While not required, keeping an eye on a stock's trading volume might help with a stock price analysis. The following explanations and principles may help comprehend and interpret volume.
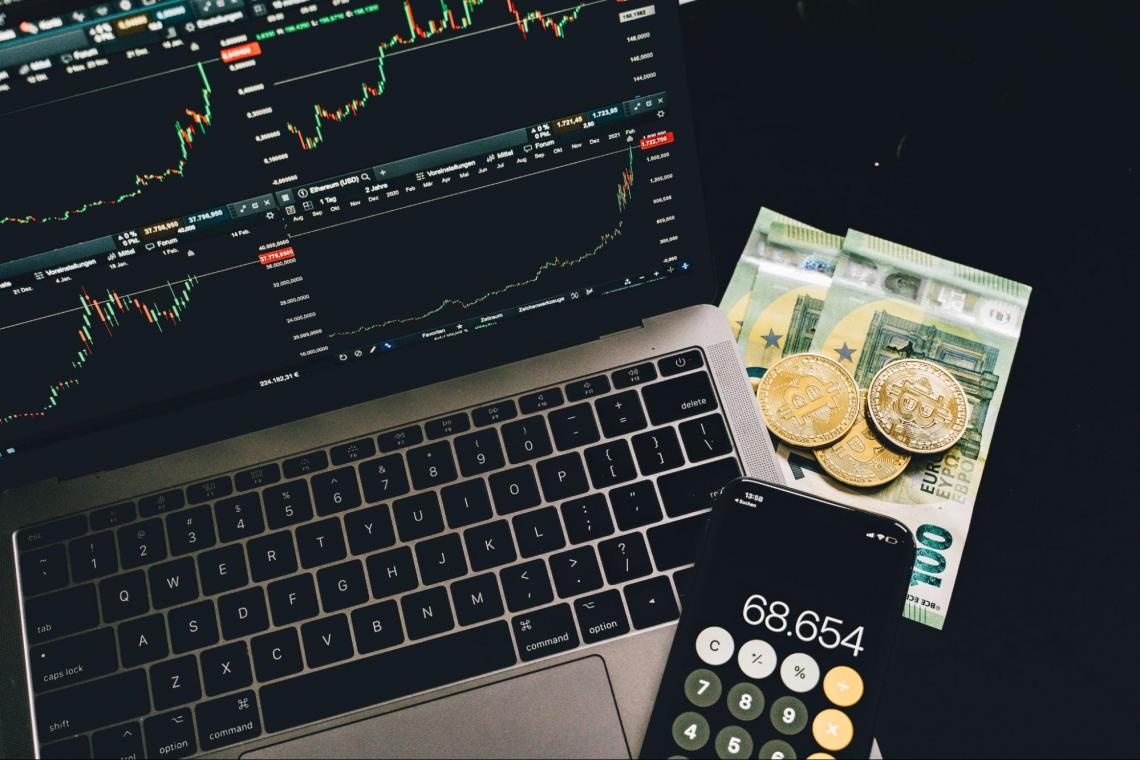
A rising volume indicates buyers and sellers are more committed to driving the price up or down accordingly.
For instance, if the volume rises as the price rises and the stock trend is upward, buyers are anxious to purchase; this often occurs with larger swings to the upside (positive returns).
Even if a trend might last for a very long time on diminishing volume, the trend usually weakens as the price trends show. For instance, if the trend increases but volume gradually decreases, it indicates that fewer people desire to buy, which will continue to drive up the price.
In pullbacks in an ideal world, the volume would be higher when prices moved in the current direction and lower when prices moved counter-trend, or "pulled back." However, this demonstrates a swift advance in the direction of the trend and feeble pullbacks, increasing the likelihood that the trend will last.

Strong price moves against the trend accompanied by high volume indicate that the trend is waning or is at risk of reversing.
The end of a trend may be signaled by an excessive volume spike, which occurs when volume trends up more than usual (five to ten times or more than average volume) for that time or period.
"Exhaustion maneuvers" are known as these: The price will soon reverse if enough shares are traded that no one is left to keep driving it in the prevailing direction.
Conclusion
To predict future price fluctuations, volume analysis looks at relative or absolute changes in an asset's trading volume. As rising markets with rising volumes are often perceived as strong and healthy, volume can be a good sign of market health.
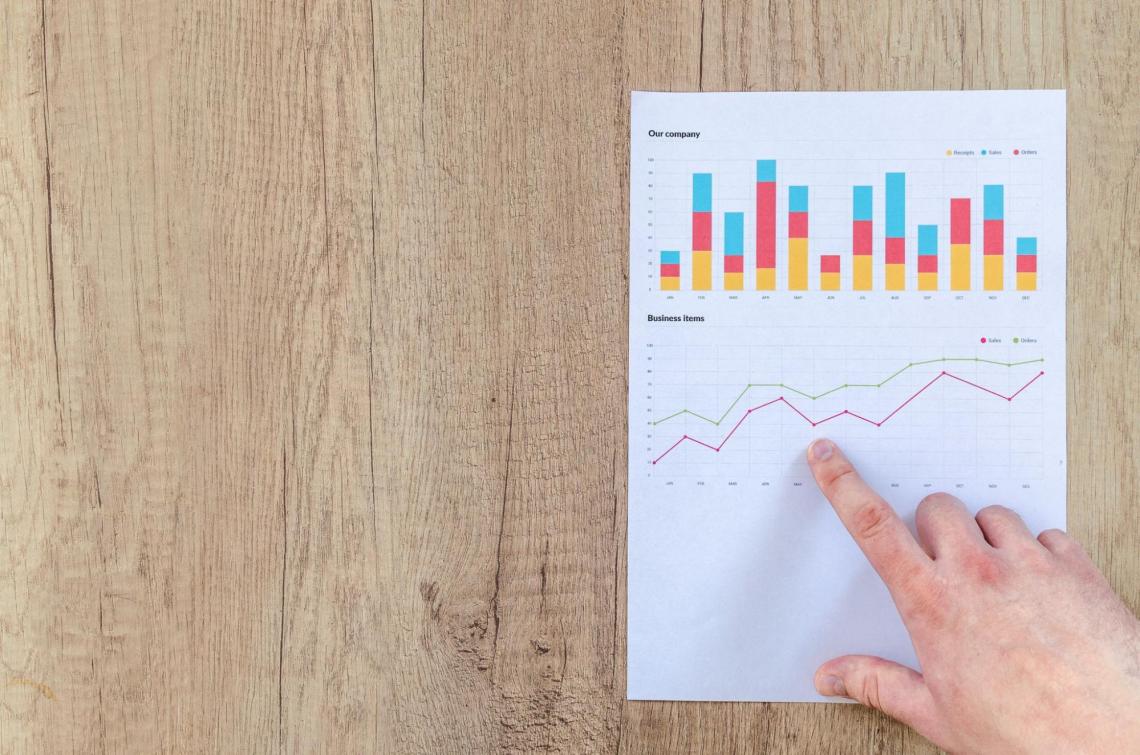
When prices decline while trading volume rises, the downward trend becomes more pronounced.
The positive volume index (PVI) uses volume in technical analysis, among other techniques.
When day trading, volume might provide helpful information. Volume analysis help isolate the stocks you're thinking about for day trading if nothing else. Your day-trading equities should ideally have a higher average volume so you can quickly enter and leave the market.
Losses may be cut where you wish with little price slippage, which helps manage risk. When you are happy with your winnings, it is simpler to collect your profits because many other traders will want to take your position (purchase from you when you sell).
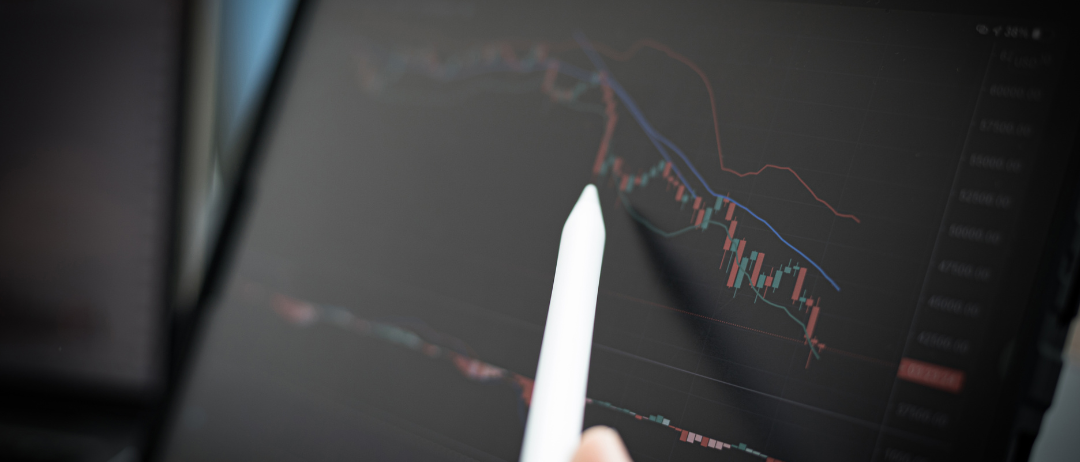
Volume can be used to study a stock's trend and determine how likely it is for it to persist. You don't need to start analyzing volume to day trade successfully; it could be better and provides extra information.
Price movements should be the primary factor when trading decisions because they dictate gains and losses. Create a stock day-trading strategy based on price changes, then use volume analysis to determine if it boosts performance.
Knowing about financial statements and analysis will enable you to understand these financial markets in a better way. It will also give you a better understanding of decisions to be made if you are involved in any financial market.


or Want to Sign up with your social account?