Zig Zag Indicator – Technical Analysis
A technical analysis indicator that helps in studying the direction of certain trends as well as in identifying any potential reversals.


What Is The Zig Zag Indicator?
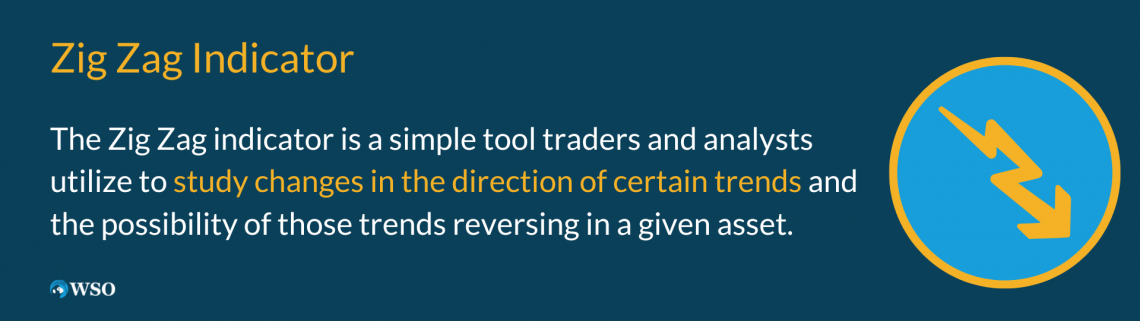
The Zig Zag indicator is a simple tool traders and analysts utilize to study changes in the direction of certain trends and the possibility of those trends reversing in a given asset.
Thus, the indicator helps eliminate noise in a given data set and some noisy conditions in a trend.
That way, the traders can isolate and focus on the overall directionality of that trend. In addition, it provides insight into and is more effective with charts looking at longer-term trends.
The tool does not highlight every single high and low of a specific set and instead illustrates a simple line that looks similar to a trend line on a chart. It uses a certain percentage of price movement in a particular asset.
The general notion among traders is that if the trend does not change by a certain X percentage, it is considered unchanged.
Note
There is no fixed or universal rule for what exact percentage by which the Zig Zag indicator is applied should be used. That being said, the default is 5%.
Traders commonly use the Zig Zag indicator because it clearly illustrates signals related to trends and their movements.
The tool can be used alongside other technical indicators to analyze price movements and ultimately facilitate trading decisions.
When markets contain sporadic or irregular patterns and high or low “swings” in the data, the charts can become more difficult to read and interpret the shifts to a trend.
So, the Zig Zag indicator can be used to smoothen the trends and make them more objective so that every trader can take away the same signals and trend movements while using this tool.
- The Zig Zag Indicator is a technical analysis tool used to identify significant price changes and filter out small, irrelevant price movements, helping traders visualize the primary trends in an asset's price.
- The indicator works by drawing lines only when price movements exceed a specified percentage threshold, effectively smoothing out the noise and highlighting major price reversals and trends.
- The Zig Zag Indicator helps traders identify the direction and strength of price trends by connecting swing highs and lows, making it easier to spot upward, downward, and sideways market movements.
- As a lagging indicator, the Zig Zag Indicator is based on historical price data and can only confirm trends after they have occurred, making it less useful for predicting future price movements.
Understanding the Zig Zag Indicator
There are many uses for the Zig Zag indicator that a trader can take advantage of, and these are outlined below:
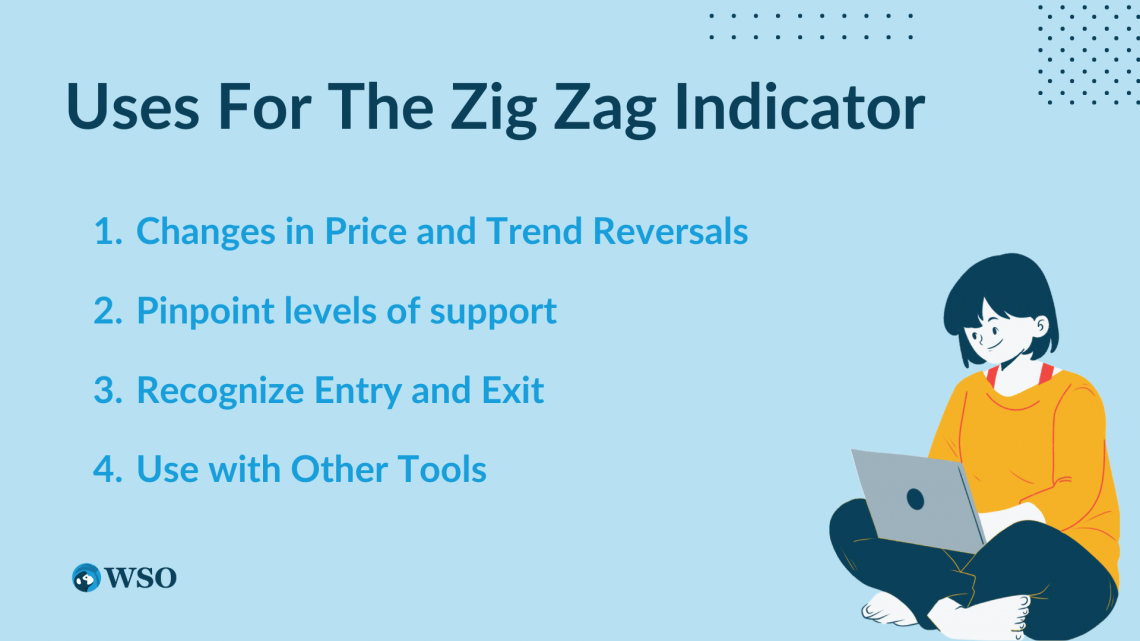
Changes in Price and Trend Reversals
Search for price changes and reversals in the overall trend when the direction of the Zig Zag line changes.
If a line moves upwards for some time, it reflects an upward trend. Conversely, when it starts heading downwards, this may indicate that the uptrend is over and a downtrend is starting to emerge, and vice versa for the other direction.
Pinpoint Levels of Support
Recognize and pinpoint levels of support and resistance. When the Zig Zag line returns to a previous low or high point in the chart, it could reflect potential support or resistance that may influence future price changes.
Support and resistance levels reflect when it is likely for the price point to favor a pause or reversal of a specific trend occurring, and the price will either continue going higher or fall back slightly.
Usually, support levels are spotted when a downtrend is likely to be paused, while resistance levels are when an uptrend is going to stop because of changes in supply and demand.
Recognize Entry and Exit
Facilitates traders' recognition of possible entry and exit points.
If an asset or security is currently in an uptrend and the indicator has a lower swing, it may reflect a possible entry point for a long position.
Note
Other more traditional tools applicable to price action are more geared towards helping traders pinpoint entry and exit points for trades.
Use with Other Tools
Utilized with other indicators and tools to substantiate the changes that are noticed, rather than rely on the view of a single tool and avoid false messages.
Note
Traders may use different analysis tools, such as moving averages, oscillators, Elliot waves, and Fibonacci retracement levels, to confirm what the Zig Zag indicator says in a particular chart.
Using the Zig Zag Indicator
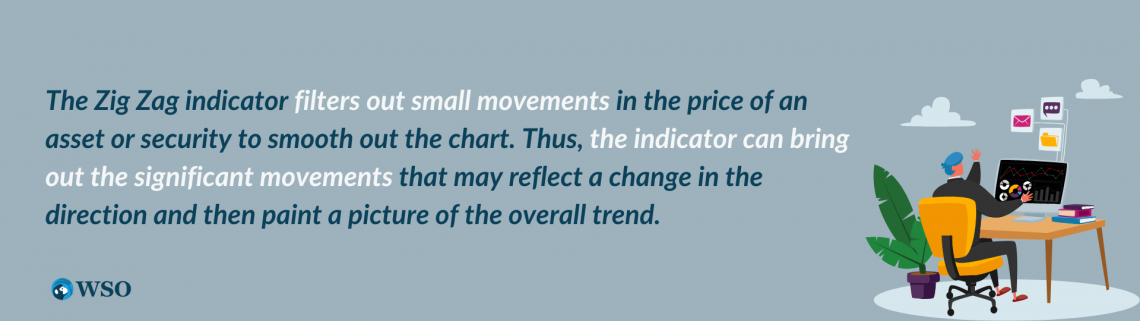
The Zig Zag indicator filters out small movements in the price of an asset or security to smooth out the chart. Thus, the indicator can bring out the significant movements that may reflect a change in the direction and then paint a picture of the overall trend.
The calculation of the tool is rather simple, and the steps are described below:
- Choose a point to start where to analyze (swing high or swing low).
- Choose a percentage for the price change to be taken as the benchmark (where the most commonly used percentage is 5%).
- Pinpoint the following swing high or swing low that exceeds your chosen threshold and mark it on the chart.
- Draw a trend line between these two points. Repeat the process with the following points. This will create a zig-zag line between the high and low swings.
Note
The price movements that are filtered out fall under a certain benchmark, which is usually a given percentage or several price points. The points that exceed this benchmark are then connected by a straight line, forming a zigzag line for the trend.
The Zig Zag indicator is already part of platforms like MetaTrader 4, so to add it to a chart, you start with three simple steps:
- Click on “Insert”
- Click on “Indicators” from the drop-down menu.
- Click on the “Custom” subcategory and pick “Zig Zag Indicator.”

After that, you can change the parameters and understand the colors. The indicator has three main parameters, which are depth, deviation, and backstep:
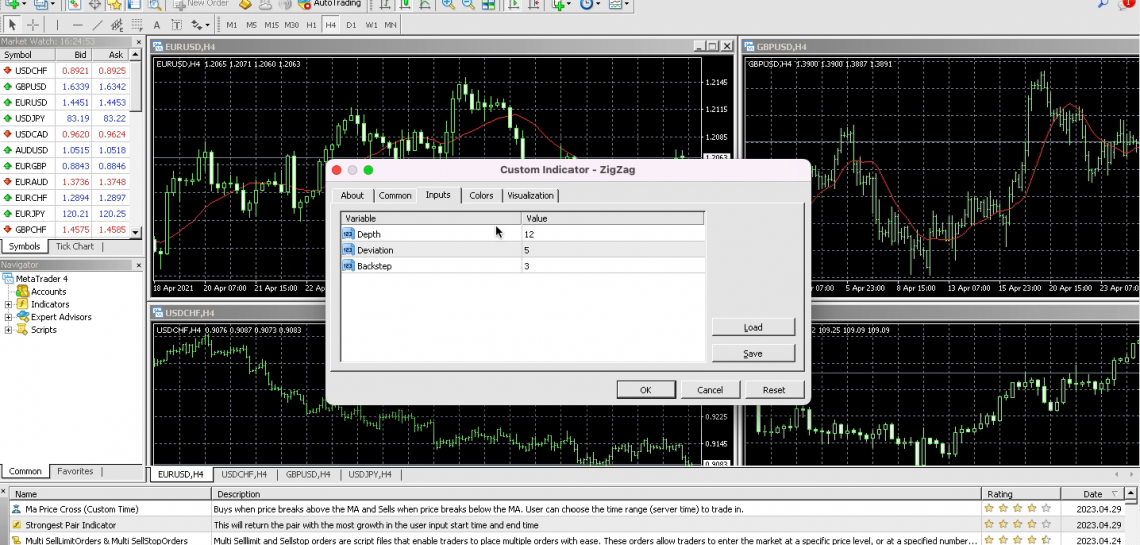
1. Depth
It is the minimum percentage value between the highs and lows of neighboring bars or candlesticks. It records the percentage of change that conveys the point with the change in the trend.
If the price falls by 5% from the high point, the indicator will display a red line falling to show that the trend has changed.
2. Deviation
It is a small distance in percentage between the highs and the lows of the two successive bars where the indicator will construct a local top or bottom.
When you increase this parameter, the lines will start to spread out.
3. Backstep
It is the minimum number of bars, or candlesticks, between the high and low points.
You can change the parameters to make the Zig Zag indicator more or less sensitive to price movements, influencing how many zigzag lines you see on the chart.
Limitations of the Zig Zag Indicator
Even though the Zig Zag indicator is quite a useful tool for traders, it has some limitations. These are outlined as follows:
1. It can be quite slow
The indicator can be quite slow to react to rapid changes in the price moving. So, if traders only use the indicator for their trading decisions, they may risk losing out on some opportunities.
2. Can lag quite often
It may take some time for the indicator to showcase changes in the price moving and the trends. When it lags, it may thus be less effective with markets with low liquidity or high volatility data.
Note
The indicator only marks values after each period closes and only creates a permanent new line after significant movements in the price, so the result tends to lag.
3. Can produce both temporary and permanent lines
The most recent line produced by the indicator, displayed on the far right side, is temporary. When the price changes direction, the indicator will start constructing a new line in that direction.
However, if that movement in price does not reach the specified benchmark percentage value before it changes direction, that temporary line will be overridden by a new one to depict the newest movement.
4. Can produce false signals
The indicator utilizes a mathematical algorithm that filters out small price movements deemed insignificant. So, it can overlook important movements that may indicate a change in the overall trend, thus creating a misleading picture.
Note
Despite these limitations, this analysis tool is still widely used by traders to spot changes in the direction and possible reversals of trends. Like any trading strategy, it is important to utilize multiple tools to make informed decisions rather than depend on only one.
Zig Zag Indicator FAQs

It is not easy to determine the “best” setting. For example, even though the default is 5%, other percentages, such as 9%, can be used.
This simply raises the threshold by which price fluctuations should be included, and so it neglects the smaller price fluctuations. Thus, traders can see the bigger picture with the significant movements.
Yes, the Zig Zag indicator lags and does not immediately show the changes and new lines. This is because it takes time for the indicator to identify and illustrate the price changes to depict the trend's overall direction and filter out the small ones.
It is rather straightforward to understand and interpret since it highlights the overall direction of the trend by neglecting the small movements in price.
If the trend is going up from the bottom left to the upper right of the chart, and thus, increasing price, the market is in an uptrend.
The alligator indicator, also known as the Williams alligator indicator or Williams indicator, is a tool used to analyze charts and pinpoint when a trend forms in forex trading, to locate potential entry and exit points for traders before they make their decisions.

Free Resources
To continue learning and advancing your career, check out these additional helpful WSO resources:


or Want to Sign up with your social account?