Elliott Wave Theory
A unique approach for decomposing and analyzing the market.


What is the Elliott Wave Theory?
There is a popular idea that in the trading world, there is no crystal ball that can accurately forecast market movement. However, Elliot wave analysis gives a unique approach for decomposing and analyzing the market, giving traders a significant advantage in making decisions.
Elliott wave theory is a technical analysis theory used to predict price fluctuations in financial markets. It is also a theory that looks for recurring long-term price patterns linked to persistent shifts in investor sentiment and psychology.
Ralph Nelson Elliott (1871–1948), an American accountant and author, began analyzing the market by noticing and identifying fractal wave patterns in the 1930s.
Investors trying to profit from a market trend are known as riders of a wave.
Elliott emphasized that these patterns do not guarantee future price movement but rather assist in understanding the probability of future market action.
To discover trading opportunities, Elliott wave theory can be used with other types of technical analysis, such as technical indicators and trend reversal patterns. The theory suggests a framework for traders to view a security/market at any particular period.
- Elliott Wave Theory is a technical analysis approach used to predict price fluctuations in financial markets by analyzing recurring wave patterns and investor sentiment.
- Developed in the 1930s by Ralph Nelson Elliott, this theory identifies impulse waves (main directional waves) and corrective waves (counter-trend movements) within market trends.
- The theory relies on fractal patterns, where smaller waves resemble larger ones.
- Elliott Wave Theory is complex and subjective, making accurate wave identification challenging.
- While valuable when used correctly, Elliott Wave Theory does not offer foolproof market predictions.
History of Elliott Wave Theory
Ralph Nelson Elliott (1871–1948), an American accountant, was forced to retire at age 58 after a long career in various accounting and commercial professions due to a sickness suffered while living in Central America.
He focused on analyzing the stock market's movement during his recovery.
Elliott's idea gained attention in 1935 when he correctly predicted a stock market bottom. Since then, thousands of portfolio managers, traders, and private investors have used his theory.
Elliott Wave International, founded in 1978, uses Elliott's model for market analysis and forecasting. It is the world's largest independent financial analysis and market forecasting company.
Elliott gave specific guidelines for recognizing, forecasting, and benefitting from these wave patterns. All the guidelines have been recorded in R.N. Elliott's Masterworks, published in 1994. The publications include books, articles, and letters.
Basic Principles of Elliott Wave Theory
Elliott wave theory mainly focuses on two essential components:
1. Momentum
The rate of change in the security price is known as momentum, reflecting the strength of a stock's trend.
A high momentum indicator, for example, reflects how quickly stock prices are moving higher or lower. Prices begin to move in range when momentum fades.
There are two main types of waves mentioned in theory:
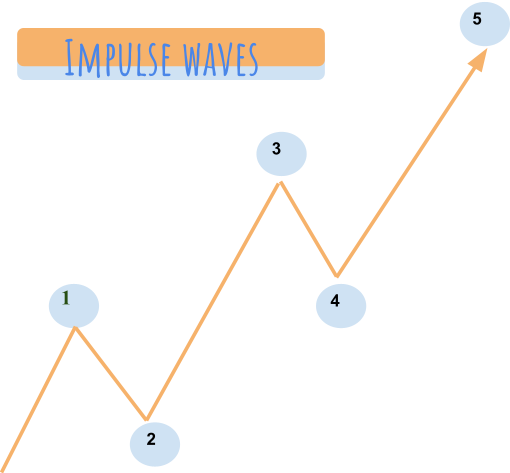
- impulse waves
- corrective waves
When market participants have similar feelings about a stock, its price will move dramatically in one direction, known as the impulsive waves. On the other hand, prices do not quickly move up or down when traders have opposite viewpoints, creating corrective waves.
2. The fractal of price action
The term fractal is used in Elliot wave analysis to describe a succession of waves subdivided into smaller and smaller sub-waves.
Fractals, in other words, can be smaller and more like the original wave, or they can repeat a sequence of patterns of varying sizes.
An ocean shoreline is a real-life example of a fractal because it repeats itself on many scales; in other words, the pattern at one scale resembles the way at larger scales. The same is true for Elliott's wave theory.
If you zoom out from any position within an impulsive wave, you'll notice that there are recurrent patterns in play that analysts can use to forecast market movements.
The assumption of market driving force: Herd Mentality: The theory behind Elliott Wave Analysis is that the prices of financial assets move in predictable patterns based on herd mentality.
Herd mentality is defined as the tendency of group members to act in ways that adhere to the group's norms rather than as individuals.
Notably, the idea assumes that herd mentality rules the market, with big groups of investors influencing how others think and act.
As a result, pricing trends are shaped by prevalent psychology. Patterns happen again as investor sentiment repeats over time, resulting in fractal patterns or waves.
Analysts and traders can study these waves to discover the best entry and exit opportunities.
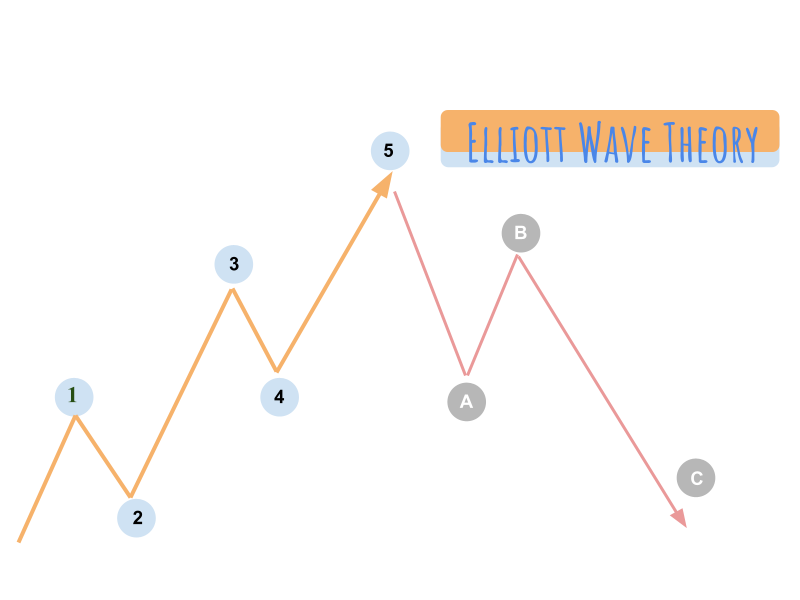
Understanding Elliott Wave Patterns in Investing
A fractal approach to investing describes how each set of waves is nested within a more significant series of waves that follow the same impulse or corrective pattern.
Regardless of sizes, wave patterns repeat themselves, with one primary impulsive wave including five smaller waves.
Elliott wave patterns are depicted in the diagram above. In the impulsive phase (1–5), a sequence of rising waves alternate with receding waves. These waves look like they're coming up the shoreline.
After that, the correction phase (A through C) begins.
Phase of Impulse
Three unbreakable rules define the impulsive waves:
- The second wave cannot retrace more than 100% of the first wave.
- The third wave can never be shorter than the first or fifth waves.
- Wave four can never reach beyond the third wave.
The structure is not an impulse wave if one of these rules is broken. Instead, the trader would have to redefine the potential impulse wave.
Wave 1
This wave is difficult to understand and rarely noticeable because the previous trend's force hasn't completely faded.
It's frequently accompanied by bad news such as low earnings predictions, gloomy feelings, and poor economic forecasts.
Moderate-to-high volatility is to be expected at this point.
Wave 2
This is a corrective wave in which the economic outlook remains bleak and bearish news reigns supreme. During the second wave, though, things start to look up. It's important to remember that this wave can't get higher than Wave 1's beginning position.
Wave 3
Wave 3 is regarded as the most powerful. However, most news is currently favorable, prices are rising, and the impact of the preceding trend is diminishing.
Wave 4
Wave 4 is the second corrective wave, with prices moving sideways and trade volumes decreasing.
Things return to normal after this stage, despite the appearance of stagnation.
Wave 5
Wave 5 is the final wave in the impulsive momentum's direction. News and feelings are bullish at this point, but trade volume is smaller than in Wave 3.
Common patterns of impulse waves
Some of the common patterns are:
1. Impulse waves
This is the most prevalent wave and is the easiest to notice in a market.
Impulse waves consist of motive waves, waves that move in the dominant direction, and corrective waves, waves that push against the dominant force.
In general, the impulse wave's pattern is found to have five sub-waves: three motive waves and two corrective waves, forming a 5-3-5-3-5 structure.
2. Diagonal wave
Another motive wave is the diagonal wave, which, like all motive waves, is made up of five sub-waves and moves in the trend's direction.
The diagonal appears to be a wedge, which could be extending or contracting. Therefore, depending on the diagonal being observed, the sub-waves of the diagonal may not have a count of five.
Like other motive waves, each sub-wave of the diagonal wave does not entirely retrace the previous sub-wave. In addition, sub-wave 3 is not the shortest.
The leading diagonal starts a diagonal wave, and the ending diagonal finishes.
3. Phase of Correction
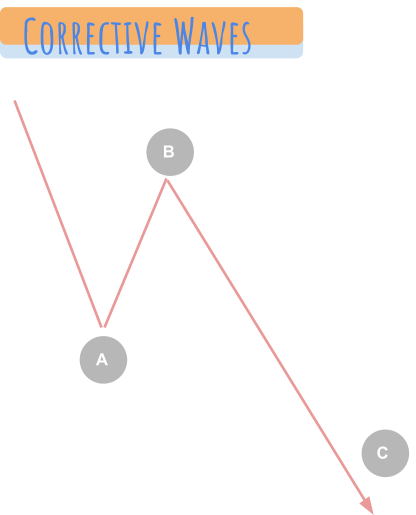
a. Wave A
Wave A is typically marked by good news. However, analysts have yet to discover that a correction has occurred. At this moment, volumes tend to decrease while prices remain unchanged.
b. Wave B
Prices reverse higher, giving the mistaken impression that the bull market is still going strong. On the other hand, trading volumes are frequently smaller than in Wave A.
c. Wave C
Wave C marks the beginning of the bear market. However, it's the same size as Wave A and has increasing volumes.
Common patterns of corrective waves
Some of the common patterns are:
1. Zigzag (5-3-5)
The zigzag is a corrective wave made up of 3 waves labeled A, B, and C that moves vigorously up or down.
The A and C waves are motive waves, whereas the B wave is corrective (often with three sub-waves).
Zigzag patterns are sharp declines in a bull rally or advances in a bear rally that substantially correct the price level of the previous Impulse patterns.
Zigzags may also be formed in a double or triple zigzag combination, where another corrective wave connects two or three zigzags.
2. Flat (3-3-5)
Another three-wave correction is flat, in which the sub-waves are generated in a 3-3-5 structure known as an A-B-C structure.
Waves A and B are corrective in the flat structure, while Wave C is motive with five sub-waves.
Because it goes sideways, this pattern is known as the flat. The fourth wave of an impulse wave is usually flat, whereas the second wave is rarely flat.
Most flats do not appear clearly on technical charts since this structure has several variations.
Wave B may end before the A wave, and the C wave may end before the start of the A wave in a flat. In this case, it is called an enlarged flat.
3. Triangle (3-3-3-3-3)
The triangle is a pattern made up of five sub-waves arranged in a 3-3-3-3-3 structure with the letters A-B-C-D-E.
This corrective pattern travels sideways and displays a balance of forces.
The triangle can either expand, with each sub-wave becoming larger, or shrink, with each subsequent sub-wave becoming smaller.
The triangles can be classified as symmetrical, descending, or ascending based on whether they are oriented sideways, up with a flat top, or down with a flat bottom.
Sub-waves can be created in a variety of ways. While seeing a triangle may seem simple in theory, detecting them in the market may require some practice.
Double three: A combination of two of the corrective patterns above.
Triple three: A combination of three of the corrective patterns above.
Limitations of Wave Analysis
No Holy Grail can guarantee winning trades, just like other technical analyses. The Elliott theory's limitations are as follows:
1. Distinguishing the waves is complex
Elliott wave theory requires complete comprehension. It is easy for beginners to be distracted by the irregular waves and mislabel them, especially the complex corrective waves.
2. Reading the waves is subjective
The interpretation of waves in the market is subjective; in other words, different traders have different perspectives given the same price charts.
3. It is not a forecast
It's not a foolproof plan. Regardless of the theory's effectiveness, there's always the possibility of an alternate scenario playing out and breaking trends.
Wave analysis by itself does not provide a comprehensive picture of the market. It requires assistance.
Other technical analysis techniques, such as moving averages and momentum indicators, should be combined with the theory to give better predictions.
How do you apply Elliott wave theory?
Applying Elliott wave theory on charts
Here are the steps you should follow to apply the theory on charts:
- Determine the wave's nature: impulsive wave / corrective wave
- Count the small waves in a trend or correction
- Make sure the rules of waves are not broken.
For an impulsive wave:
- Wave 2 cannot retrace lower than wave 1.
- Wave 3 could be the longest, but it can never be the shortest between waves 1,3,5.
- Waves 4 and 1 can't be at the same place within the same trend.
For a corrective wave:
- Corrective wave B must not retrace more than 100% of wave A.
- Wave B will bottom in the price zone of impulsive wave 4.
- The sudden resuming trend always fully retraces corrections.
Elliott wave theory and the Fibonacci sequence:
According to Elliott, the Fibonacci sequence specifies the number of waves in impulses and corrections. Fibonacci ratios are common in price and time wave correlations, such as 38 percent and 62 percent.
A corrective wave, for example, may retrace 38 percent of the initial surge.
Final Thoughts
Technical analysis of any form, including Elliott wave analysis, is only a tool, similar to a surgeon's knife, that can be used to save or harm people. You must realize that traders must adhere to the rules. Otherwise, traders will be unable to recover from their losses.
Given its intricacies and the need to comprehend the waves deeply, Elliott wave theory is one of the most underutilized technical analysis techniques. As a result, there is a widespread belief that the theory is incorrect and incapable of generating profits.
However, academic research and veteran traders have shown that if employed appropriately, this strategy works. To make lucrative judgments, you must comprehend the underlying concepts behind them.
Furthermore, combining this theory with other technical and fundamental research approaches is best. This helps to understand the market better and create more accurate price predictions.


or Want to Sign up with your social account?