CAGR vs IRR: What’s the Difference and When to Use Each in Your Model?
Learn the key differences between CAGR vs IRR: definitions, formulas, examples, and when to use each to judge investments, projects, and real estate deals.


CAGR vs IRR: An Overview
CAGR (Compound Annual Growth Rate) and IRR (Internal Rate of Return) are both methods for measuring investment performance, but they serve distinct purposes.
CAGR represents the average annual growth rate of an investment over a specified period, assuming steady growth. It’s useful for comparing how different investments perform over time.
For example, if you invest £1,000 and it grows to £2,000 in 5 years, CAGR tells you the consistent yearly rate that got you there.
IRR, on the other hand, considers the timing of cash flows. IRR, on the other hand, considers the timing of cash flows by accounting for cash inflows and outflows at different times. It is often used in business projects or private equity deals where investments and returns happen in stages.
In short, CAGR is simple and works best for single investments without irregular cash flows, while IRR is more complex but better for projects with multiple cash inflows and outflows. Both are valuable, depending on context.
- CAGR is straightforward: start value, end value, and time period. IRR requires more detailed calculation since it solves for the discount rate that sets the net present value of cash flows to zero.
- CAGR works best for evaluating lump-sum investments or comparing funds. IRR is better suited for business projects, private equity, or real estate, where investments and paybacks occur in stages.
- CAGR ignores volatility and cash flow timing, while irregular cash flows or multiple solutions can distort IRR.
CAGR gives a single, easy-to-understand growth rate, making it ideal for quick comparisons. IRR, while more complex, provides deeper insight into the profitability of cash-flow-heavy projects. - CAGR assumes reinvestment at the same growth rate, whereas IRR assumes reinvestment at the IRR itself. This key difference affects how realistic the results are.
What is the Compounded Annual Growth Rate (CAGR)?
The smoothed annual growth rate of an investment (or business metric) over a period, assuming it grew at a steady, compounded rate from the starting value to the ending value.
CAGR, or Compound Annual Growth Rate, is a simple way to see how something grows over time. Instead of just averaging the numbers, it takes compounding into account, which provides a more accurate picture of long-term growth.
People use it to compare the performance of different investments, companies, or business strategies on the same scale. CAGR smooths out the fluctuations that occur from year to year. It is often viewed as a clearer measure than simply examining individual annual returns.
Calculating CAGR
To calculate CAGR, we simply need three components:
- Initial value
- Final value
- Time period
Once we have these three components, we can calculate the metric. The formula is:
(( Final Value / Initial Value ) ^ (1/n)) -1
What CAGR provides is the annual return on our initial value.
At the end of each year, we multiply by our new total (to account for compounding). We are trying to find the rate of return that takes us from the initial to the final value.
By dividing our final value by our initial value and taking the nth root, we obtain exactly what we need. Then, subtracting -1, we arrive at the CAGR.
CAGR Example
Suppose you invested £1,000 in 2019, and by 2024 (5 years later), it grew to £2,000
By inputting these values into the CAGR formula, you would find a % value of 14.87
CAGR = [(2000/1000)^1/5] - 1
CAGR = (2^0.2) - 1
CAGR ≈ 1.1487 - 1 = 0.1487 or 14.87%
What is the Internal Rate of Return (IRR)?
The discount rate that makes the net present value (NPV) of all future cash flows (in and out) from an investment equal to zero.
Calculating IRR
To calculate IRR, you need:
- The initial investment amount (cash outflow at t=0)
- The timing of cash flows (periods 1, 2, … n)
- The amount of each cash inflow/outflow
Once we have these components, we can calculate the metric.
Although the formula itself cannot be solved algebraically (it requires iteration or a financial calculator), the intuition is presented below as supplementary.
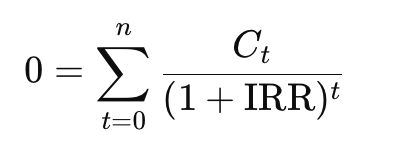
Where:
- C0 = initial cash outflow (negative), this is the amount you ‘pay’ at the start for the investment.
- Ct = cash inflows at time t
What IRR gives us is the discount rate at which the net present value (NPV) of all cash flows equals zero.
At this discount rate, the present value of future inflows perfectly offsets the initial outflow.
We are trying to find the effective annual rate of return generated by the project/investment, given its pattern of cash flows.
By solving for the rate that makes the NPV equal to 0, we obtain the IRR. What IRR does is place greater value on earlier cash flows, since money received sooner can be reinvested to generate additional returns.
IRR Example
Suppose you invest £1,000 today (t = 0).
You then receive the following cash inflows:
- Year 1: £400
- Year 2: £400
- Year 3: £400
We want to find the IRR/ the discount rate that makes the NPV = 0.
0 = -1000 + [400/(1 + IRR)^1] + [400/(1 + IRR)^2] + [400/(1 + IRR)^3]
There’s no closed-form algebraic solution, so we solve iteratively (trial and error or calculator/Excel).

At IRR = 10%
NPV = -1000 + [400/1.1] + [400/(1.1^2)] + [400/(1.1^3)] ≈ -£5
AT IRR ≈ 9.9%
NPV ≈ 0
CAGR Vs IRR
Let’s understand the main difference between the two in the table below:
| Aspect | CAGR (Compound Annual Growth Rate) | IRR (Internal Rate of Return) |
|---|---|---|
| Purpose | Measures the average annual growth of an investment over a set period, assuming steady compounding. | Measures the true rate of return by considering the size and timing of all cash flows. |
| Complexity | Simple, only needs 3 inputs: initial value, end value, and time period. | More complex, requires initial investment, timing, and size of each cash flow, plus the end value. |
| Treatment of Cash Flows | Ignores cash flow timing and volatility; smooths growth evenly across years. | Accounts for irregular cash flows, timing, and reinvestment, giving a more detailed performance picture. |
| Example Effect | £100 per year vs. £200 every other year → CAGR gives the same result, ignoring timing differences. | £100 per year vs. £200 every other year → IRR produces different results because cash flow timing matters. |
| Use Cases | Best for lump-sum investments, comparing funds, or evaluating growth over time. | Best for projects, private equity, or real estate with multiple cash inflows and outflows. |
| Interpretation | Shows the smoothed annual growth rate, better than a simple average because it accounts for compounding. | Captures profitability in the context of timing and scale of cash flows, directly comparable to benchmarks. |
When do we use IRR vs CAGR?
Use CAGR when you want a clean, single-number summary of growth between a beginning value and an ending value, with no meaningful interim cash flows.
It’s ideal for buy-and-hold performance or comparing strategies where the timing and size of contributions/withdrawals are the same or irrelevant.
CAGR smooths the path, making it suitable for communication and benchmarking, but it deliberately ignores the pattern of returns along the way.
Use IRR when the timing and size of cash flows are important.
Real projects, private equity, real estate, venture capital, dollar-cost averaging, staged investments, and any investment with deposits, withdrawals, coupons, dividends, or a terminal sale require IRR.
IRR is money-weighted: earlier cash flows are worth more because they can be reinvested longer. It’s also the right tool for hurdle/WACC comparisons (accept if IRR ≥ hurdle).
Practical rules
Some practical rules include:
- No interim cash flows / just start → finish? Use CAGR
- Irregular cash flows or staged capital? Use IRR
- Choosing between mutually exclusive projects of different scale/timing? Rank by NPV first; use IRR as a secondary check.
Be aware: multiple sign changes can produce multiple IRRs; CAGR doesn’t have this issue.
Bottom line: CAGR tells you the smoothed growth rate of a single investment. IRR tells you the earned return on a dated series of cash flows.
CAGR vs IRR in Real Estate
Real estate money doesn’t grow in one smooth line. You pay for land, invest in building work, and maybe earn some rent, then sell because money moves at different times; timing matters.
Use IRR to judge the deal. IRR values early cash flows more heavily and reduces the value of delayed ones, making it ideal for staged projects or build-to-sell deals.
Use CAGR to describe the value trend. It shows how a property’s value grew from start to finish, ignoring the fluctuations in between. Fine for simple buy-and-hold or market price appreciation.
In summary, both metrics have their place, and it depends on whether you are interested in timing or just the start versus the end value.
Summary
CAGR (Compound Annual Growth Rate) represents the average annual growth of an investment, assuming smooth and consistent compounding from the start to the finish. It is straightforward to calculate, requiring only the initial value, final value, and time period, and is best suited for comparing buy-and-hold investments or market benchmarks.
The Internal Rate of Return (IRR), on the other hand, is a more advanced concept. It measures the effective annual return by considering the exact timing and size of all cash flows, making it the right tool for projects, private equity, real estate, or any investment where money moves in and out at different times.
In practice, use CAGR for a quick and clean view of overall growth, and use IRR when cash flow timing matters and you need to judge whether returns clear a hurdle rate.
CAGR Vs. IRR: Differences and When to Use Them in Financial Model FAQs
Neither is “better”—CAGR is simpler and suitable for clean growth comparisons, while IRR is more suitable when cash flows are uneven.
Yes, if there’s only one initial investment and one final return, both will show the same growth rate.
Because it requires solving for the discount rate that makes net present value zero, it often needs software or financial calculators.
Use CAGR for a quick, clear view of average growth, like comparing stock or fund performance over time.

Free Resources
To continue learning and advancing your career, check out these additional helpful WSO resources:


or Want to Sign up with your social account?