EV/EBIT Ratio
A valuation multiple used to determine a security's relative value


What Is The EV/EBIT Ratio?
EV/EBIT is a valuation multiple used to determine a security's relative value. It uses two components - enterprise value and earnings before interest and taxes (EBIT). A close valuation ratio is used to compare businesses that have similar financials and business models.
The ratio is similar to the Price-to-Earnings multiple in that it also considers the entire value of the business divided by some profitability metric.
As the ratio includes a company's debt levels and the EBIT is more complicated to manipulate than simple earnings, the EV/EBIT multiple, in some cases, is considered superior to the PE multiple as it gives a clearer picture of the valuation of the business.
It has two components: the enterprise value of a firm and the earnings before interest and taxes.
EV/EBIT = Enterprise Value / EBIT
To better understand the ratio, let us dive deeper into each component.
1. Enterprise Value
The enterprise value is the total value of the business, which includes the market value of its equity, which is the current market capitalization. The total debt on the books is added, and any cash with the business is deducted.
Enterprise Value = Market Value of Equity + Total Debt - Cash
Instead of total debt, some models use the market value of the debt. There are several ways to calculate the market value of debt.

Short-term debt is usually taken at book value as it will be paid off within a year, so there is usually no significant difference between the values (book and market value). The market value of long-term debt can be estimated by either taking the value of the bonds or debentures trading in the market.
However, not all debt is traded on the market; most of the debt, i.e., bank debt, is non-traded.
The best way to estimate the MV of bank debt is to assume the entire debt as one coupon bond, the interest payments as coupons, and maturity as the weighted-average debt maturity.
The additional components of adding debt and subtracting cash balance make the EV a good valuation measure. EV tells how much it will take to acquire the entire business, including the company's debt and any excess cash that remains with the firm.
2. Earnings Before Interest and Taxes
EBIT is calculated by adding interest to the pre-tax profits. The EBIT is more difficult to manipulate than the earnings, so it is considered a better alternative to basic earnings.
EBIT = Profit Before Tax + Interest
EBIT ignores non-cash charges like depreciation and amortization and any other tax charges. This makes it possible to compare firms with different depreciation methods and tax rates. However, EBIT can still account for the debt on the books with the interest component.
- Enterprise Value = Market Capitalization + Total Debt - Cash
- EBIT = Before Tax Profits + Interest Expenses
- EV/EBIT considers the company’s debt while calculating a valuation multiple.
- This multiple can be used for companies with varying taxation and depreciation rates, as it ignores both inputs and gives us a more comparable multiple.
- The EPS can be manipulated and be affected by corporate actions like buybacks, unlike EBIT, which is much more challenging to manipulate.
- The EV/EBIT multiple suits firms with higher debt levels.
Understanding the EV/EBIT Ratio
It is interpreted similarly to the P/E, where a higher ratio hints that the asset might be overvalued, while a lower ratio can hint at an undervaluation.
The higher a company's debt, the more accurate this ratio gets at valuing the company, as P/E cannot justify the debt on a company's books.
It ignores the non-cash expenses and gives us a multiple based only on the cash profits of a firm. EV/EBITDA is also another multiple used for relative valuation.
A valuation based only on cash profits accurately represents a company's cash flow generation.
The EV/EBIT multiple can generally be used for almost all companies with a decent amount of debt. Still, it works best for service companies with long gestation periods and higher Capex requirements like FinTech, Telecom, and E-commerce.
A few points must be kept in mind while analyzing the multiple.
-
One is that the debt on the books should not be high-yield debt, and the EBIT margins should be predictable to a certain degree then. Therefore, only this multiple can give an accurate representation of the value.
-
High-yield debt is unsuitable for any company and will result in a higher multiple.
The multiple can be trailing or forward. Trailing or TTM means it is a representation of the past 12 months of financial performance, while forward means representing the forecast for the next 12 months.
Calculation of EV/EBIT Ratio
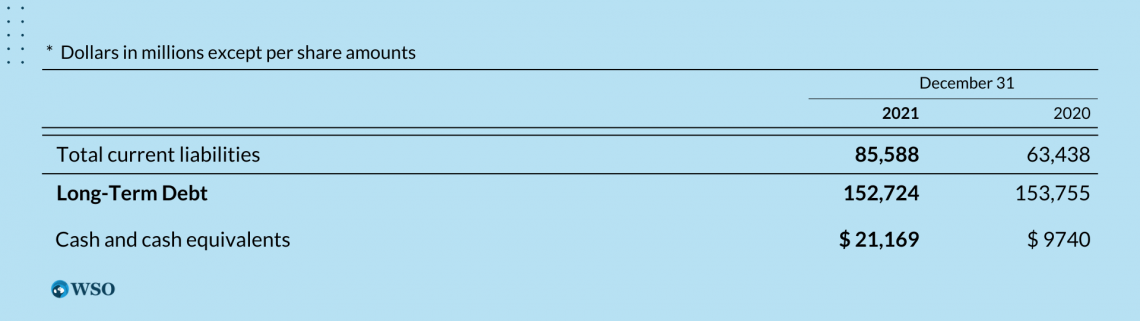
Let us understand how to compute this multiple with the help of an example. Following is the AT&T annual report for the financial year ending 2021.
The Market Cap of AT&T stands at $140 Billion
Market Value of Equity = $140 Billion
Total debt = $237 Billion
Cash = $21 Billion
The Enterprise Value of AT&T is $ 356 Billion
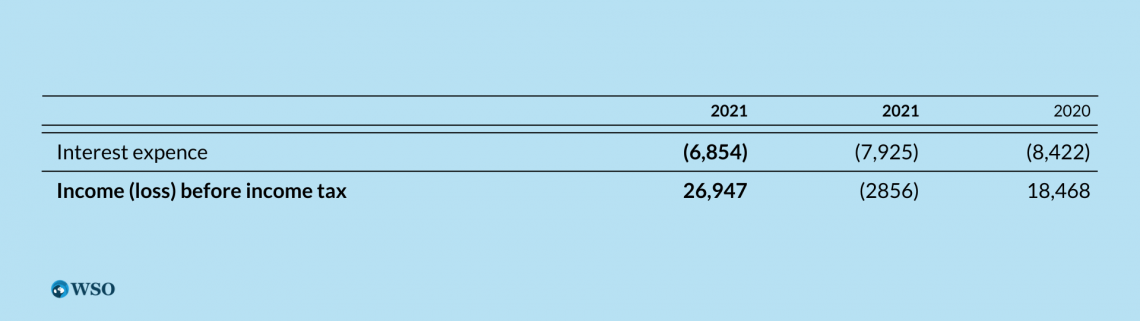
EBIT = $26 Billion + $6.8 Billion
EBIT = $33 Billion
EV/EBIT = $365 Billion / $33 Billion
EV/EBIT = 10.78x
The EV/EBIT for AT&T is 10.78x
When compared with the multiple other providers in the US.
AT&T is undervalued when compared to its peers. However, categorizing a stock as undervalued based on only one ratio may not be very sensible. Instead, try to use various measures to compute the intrinsic value.
You can find the list of EV Multiples for all US sectors here.
Advantages & Limitations of EV/EBIT ratio
On the positive side, the EV/EBIT ratio provides an excellent means for investors to compare the profitability and value of a company, irrespective of its capital structure. This is particularly useful when comparing companies from different industries or geographical locations.
However, the ratio also has its limitations. For instance, it assumes that the business is a going concern and does not account for differences in growth rates and risk levels among different companies.
Like all other financial metrics, the EV/EBIT ratio presents both advantages and limitations that practitioners should be aware of.
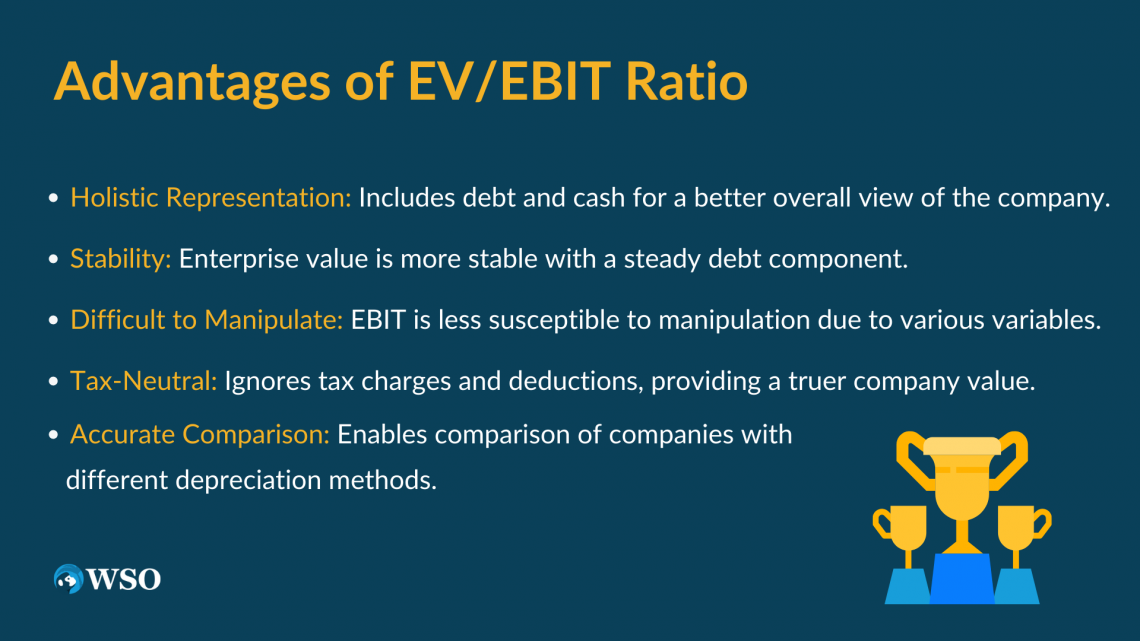
The advantages of EV/EBIT ratio are:
-
Includes debt and cash on the company books to represent the company as a whole better.
-
Enterprise value, unlike market cap, is more stable as the debt component is more steady. Earnings before interest and tax are difficult to manipulate as they have more variables.
-
The multiple ignores any additional tax charges and deductions that can drastically affect the post-tax profit, which can give a false representation of the actual value of a company.
-
This ratio allows us to compare similar companies with different depreciation methods. This opens doors for a more accurate representation of the true value of a company.
-
The ratio is not affected by stock increases compared to the P/E multiple because it has other variables like debt and cash.
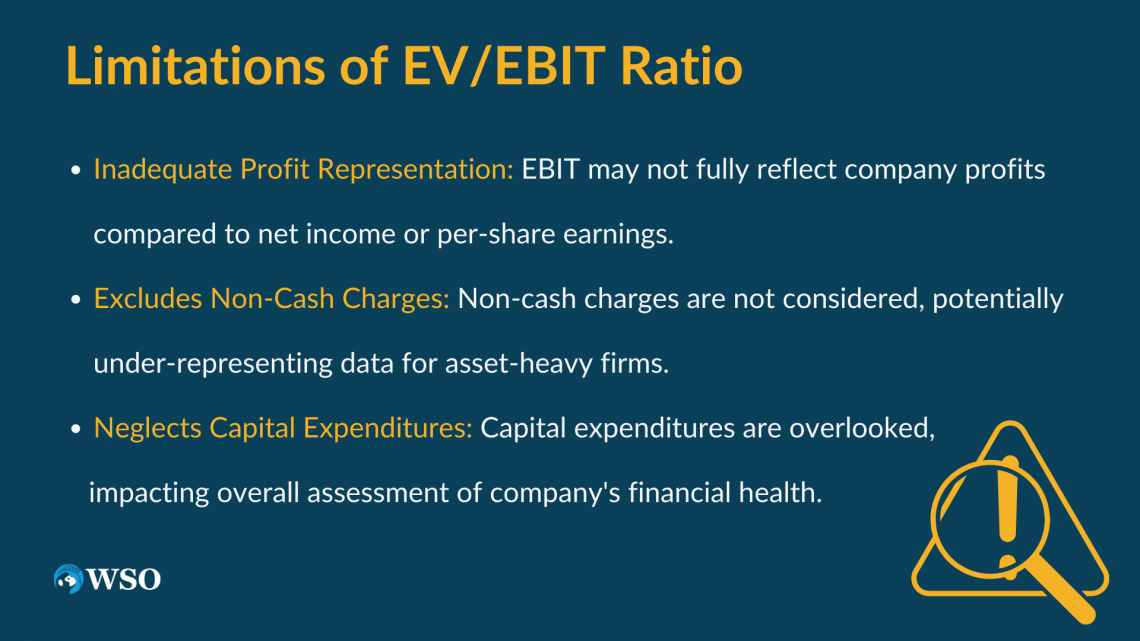
The limitations are:
-
The EBIT multiple has its limitations. One is that earnings before interest and taxes are not a reliable reflection of company profits like net income or per-share earnings.
-
The multiple does not consider non-cash charges. Therefore at times, it can under-represent the available data, especially for companies with high assets or depreciation rates that harm net income but positively affect the cash flows.
-
Another drawback is that the multiple does not consider capital expenditures.
what is Magic Formula?
The magic formula was derived by Joel Greenblatt, the founder and fund manager of Gotham Capital.
The magic formula was made to serve as a combination of value and qualitative rule-based investing that eliminates any human error and bias while still focusing on being able to buy quality stocks at a discount.

- Using the rule-based magic formula, Gotham Capital could average 50% pre-fees CAGR from 1985 to 1994.
- It was inspired by Ben Graham's net current asset value per share (NCAVPS) filter, where total liabilities and preferred stock were subtracted from existing assets and then divided by the number of shares.
NCAVPS = Current Assets - (Total Liabilities + Preferred Stock) / Shares Outstanding
The NCAV filter was outdated at Greenblatt's time as there was less to no institutional activity in the markets during Ben Graham's time, which allowed the securities to be traded at a heavy discount due to a lack of liquidity and data availability.
The Magic Formula is based on two simple ratios, return on invested capital (ROIC) and earnings yield (EBIT/EV). This filter is used on the top-rated S&P 500 stocks, the number of stocks should not exceed 20, and the filtered stocks should be held for a year. The process can then be repeated.
NOTE
The stocks that are in loss before the completion of the holding period can be sold before a year gets completed for tax-loss harvesting.
Components of the magic formula
The magic formula comprises two variables, ROIC and the earnings yield, and one is a qualitative filter while the other is a value filter.

1. Return on Invested Capital
The ROIC is the 'quality' filter, and a high ROIC tells us that a business can earn higher on the capital it puts back into the business. But, again, this is because it has some competitive advantages and barriers built around its business.
ROIC = NOPAT / Invested Capital
Net Operating Profit After Tax (NOPAT):
(Pre - Tax Income + D&A + Interest Paid) * (1 - Tax Rate)
Invested Capital = Equity + Long Term Debt
The ROIC is better than other profitability metrics like ROCE and ROE as these ratios have certain limitations. For instance - ROE only calculates the return generated on the equity capital of the business.
2. Earnings Yield (EBIT/EV)
The earnings yield is the inverse of the P/E ratio. The P/E tells us the entire firm's values compared to its earnings.
The earnings yield flips the numerator and denominator, showing the actual % yield of the profits compared to the entire market value of the firm.
Example: The P/E of Apple Inc. is calculated by dividing its price by its per-share earnings.
Price = 156.08
EPS(TTM) = 6.01
P/E = 26.07
The Earnings Yield would be 6.01/156.08 = 3.8%.
This means Apple is yielding 3.8% earnings for every share.
But instead of P/E, Greenblatt used the EV/EBIT multiple because it eliminates any varying tax charges and depreciation methods, making it easier to compare companies.

Researched and authored by Aditya Salunke I LinkedIn
Free Resources
To continue learning and advancing your career, check out these additional helpful WSO resources:


or Want to Sign up with your social account?