Transaction Multiples
A financial metric used for company valuation, commonly in mergers and acquisitions for comparable analysis.


What are Transaction Multiples?
A transaction multiple is a financial metric that is used to value a company. It is most commonly used in the context of mergers and acquisitions as part of the comparable analysis method of valuation.
![]()
This method of valuation is fundamentally different from the discounted cash flow (DCF) method in the sense that it provides a metric based on current trends in the market rather than the intrinsic value of the business being valued.
Examples of these multiples are Enterprise Value / Revenue, Enterprise Value / EBITDA, and Price to Earnings. As enterprise value (EV) is not affected by the capital structure of the company, it is commonly used as the numerator in transaction multiples to increase comparability among different companies employing varying degrees of leverage.
- Transaction multiples are valuation metrics used to assess the value of a company or asset based on financial metrics from comparable transactions in the market.
- The most frequently used transaction multiples include Price-to-Earnings (P/E), Enterprise Value-to-EBITDA (EV/EBITDA), and Price-to-Sales (P/S).
- Transaction multiples are widely used in mergers and acquisitions (M&A) to estimate the value of a target company by comparing it to similar businesses that have been recently sold or acquired.
- When using transaction multiples, it's essential to choose comparable transactions that are alike in size, industry, geography, and market conditions to ensure relevance and reflection of the specific market segment.
Transaction Multiple - How to calculate?
Transaction multiples generally compare two factors, i.e., a value and a value driver. Choosing the right value driver for the value being used in the multiple is of utmost importance to derive any meaningful relationship and can make or break the use case of the derived multiples.
The most commonly used value for calculating transaction multiples is the enterprise value (EV). And for good reason. EV includes the overall value of the company, including debt, equity, and other securities, such as preferred stocks.
The advantage of using EV over other values, such as equity, is that it is not affected by the capital structure of the company.
For example, a company can employ increasing levels of cheap debt to increase the value of its equity until its cost of debt rises above its cost of equity, after which the value of its equity starts to drop.
These adjustments are difficult to estimate and, hence, are best avoided. As the overall value of debt and equity is theoretically constant (it is impossible to create value from just changes in the capital structure), EV, which includes both debt and equity, provides a valuation metric that can be used for comparison across companies employing varying degrees of leverage.
To understand the advantages of EV multiples over equity multiples, below is a video from our valuation modeling course.
The next step involves finding the factors that affect the value being compared, which are also called value drivers. As EV includes both debt and equity, we cannot use net income as it is not available to debt holders. Hence, we need to take into consideration both the interest expense, as well as the net income available to shareholders.
Two very common metrics fit this requirement and are used to analyze profit-generating companies; Earnings before interest and tax (EBIT) and Earnings before interest, tax, depreciation, and amortization (EBITDA).
Both these metrics represent profits before the deduction of interest and, by extension, the earnings available to both debt and equity owners.
The difference between EBIT and EBITDA is that EBIT includes the impact of depreciation and amortization (which are non-cash expenses and hence can be manipulated), while EBITDA excludes their effects.
This is important to consider, especially while comparing companies that employ varying levels of fixed capital, as this would impact the comparability of the calculated multiples. EBITDA is considered the better among the two for this reason.
A question asked frequently is what value driver to use in new companies that are yet to turn profitable. In such companies, using the amount of loss (negative earnings) as a proxy to the value driver leads to a negative transaction multiple, which is useless to analysts valuing a company (early-stage companies generally have a positive valuation despite incurring losses).
This is where metrics like revenue are used, which is generally always positive despite losses being incurred by the company. However, using revenue as a proxy for earnings while valuing mature companies may lead to unreliable multiples.
To understand the various metrics used as value drivers to calculate these multiples, please have a look at the following video from our valuation modeling course.
To calculate the transaction multiple, all you need to do is divide the value by its value driver.
For example, let’s assume that Monkeys Ltd. generates revenue of $128 million, an EBITDA of $32 million, an EBIT of $25 million, and a net profit of $16 million. Further, the capital structure of the company is divided into equity shares of market value is $300 million and debt of $100 million. The following multiples can then be arrived at using the information provided:
- EV / Revenue – 12.50 ($400 million / $32 million)
- EV / EBITDA – 16 ($400 million / $25 million)
- EV / EBIT – 25 ($400 million / $16 million)
- Price to earnings – 18.75 ($300 million / $16 million)
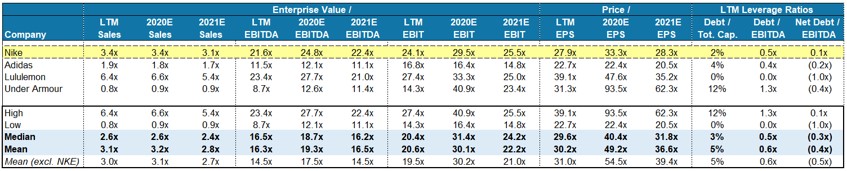
But in real life, these multiples are never calculated on a standalone basis, as it gives the analysts no real meaning. Looking at the example above, it is very hard to say if Monkeys Ltd. is over, under, or fairly valued. Hence, they are almost always calculated across multiple companies.
The picture below, taken from our valuation modeling course, shows how the target company’s (Nike) multiples are compared against its competitors to give a better understanding of its valuation.
While picking the metrics to use for value and value drivers to calculate the multiples, it is important to make sure that they have the following characteristics.
Consistency Between Value And Value Driver
It is important to make sure that the value and value driver used for calculations are related and provide consistent values. For example, it would be illogical to use EBIT as a value driver for equity as it contains both debt and equity-related returns. Hence, it is necessary to ensure that there exists some logical relation between the two metrics used while using multiples.
Using Information Available On The Announcement Date
Another point to keep in mind while using the figures for calculating the multiples, especially in the context of precedent transactions, is to ensure that the figures used are those that were available on the date of the announcement of the transaction.
This is to eliminate the effect of any changes that occurred after the transaction date. For example, while calculating the EV / EBITDA multiple of a transaction that was announced six months, it is necessary to use only data that was available back then and not the current EV / EBITDA multiples.
![]()
Transaction multiple vs. trading multiples
The difference between transaction and trading multiples is the source and type of data used.
Trading multiples refer to ratios calculated on publicly traded companies, using market data for price and the latest financial statements. As price points are available and fluctuate every day, trading multiples can change from one day to another.
Another important characteristic of trading multiples is that they can be calculated for any historical period where the company was publicly traded.
Transaction multiples refer to ratios calculated based on the announced acquisition prices of a transaction. As these data points are available only at the date of transaction, these multiples can only be calculated on that particular date. Also, as not all data regarding the transaction are publicly available, it may not be possible to calculate or adjust for all influencing factors.
Transaction multiples by industry
Below is a table highlighting the EV / EBITDA and EV / EBIT multiples across various industries and countries, last updated on January 2021, as provided by Ashwath Damodaran, Professor of Finance at the Stern School of Business in New York, on his website providing various financial datasets.
| Industry Name | EV / EBITDA | EV / EBIT |
|---|---|---|
| Advertising | 8.86 | 16.08 |
| Aerospace/Defense | 12.15 | 20.31 |
| Apparel | 14.69 | 33.98 |
| Auto & Truck | 45.73 | 177.76 |
| Auto Parts | 10.07 | 23.28 |
| Beverage (Alcoholic) | 17.61 | 22.21 |
| Beverage (Soft) | 20.74 | 25.22 |
| Broadcasting | 7.84 | 10.93 |
| Building Materials | 13.27 | 18.17 |
| Business & Consumer Services | 17.40 | 31.21 |
| Cable TV | 11.11 | 20.20 |
| Chemical (Basic) | 10.01 | 20.70 |
| Chemical (Diversified) | 13.38 | 29.25 |
| Chemical (Specialty) | 15.56 | 26.53 |
| Computer Services | 10.70 | 17.96 |
| Computers/Peripherals | 24.76 | 32.89 |
| Construction Supplies | 15.23 | 23.47 |
| Diversified | 11.37 | 15.12 |
| Drugs (Biotechnology) | 14.40 | 57.63 |
| Drugs (Pharmaceutical) | 14.32 | 22.27 |
| Education | 14.43 | 31.21 |
| Electrical Equipment | 15.96 | 22.83 |
| Electronics (Consumer & Office) | 18.96 | 59.52 |
| Electronics (General) | 17.52 | 32.12 |
| Engineering/Construction | 10.85 | 19.80 |
| Entertainment | 36.26 | 89.24 |
| Environmental & Waste Services | 14.98 | 27.42 |
| Farming/Agriculture | 14.71 | 20.13 |
| Food Processing | 12.88 | 16.83 |
| Food Wholesalers | 15.87 | 35.36 |
| Furn/Home Furnishings | 9.73 | 15.82 |
| Green & Renewable Energy | 22.94 | 50.76 |
| Healthcare Products | 28.53 | 49.25 |
| Healthcare Support Services | 10.36 | 13.63 |
| Healthcare Information and Technology | 29.32 | 50.49 |
| Homebuilding | 9.54 | 10.23 |
| Hospitals/Healthcare Facilities | 8.97 | 16.18 |
| Household Products | 17.60 | 22.33 |
| Information Services | 31.70 | 44.48 |
| Insurance (General) | 9.99 | 15.01 |
| Insurance (Life) | 12.51 | 15.00 |
| Insurance (Prop/Cas.) | 9.69 | 12.33 |
| Investments & Asset Management | 26.17 | 30.60 |
| Machinery | 16.70 | 23.08 |
| Metals & Mining | 13.90 | 25.92 |
| Office Equipment & Services | 8.82 | 14.77 |
| Oil/Gas Distribution | 9.12 | 13.95 |
| Oilfield Svcs/Equip. | 11.35 | 95.78 |
| Packaging & Container | 10.34 | 17.48 |
| Paper/Forest Products | 7.71 | 15.65 |
| Power | 11.89 | 22.26 |
| Precious Metals | 10.30 | 21.45 |
| Publishing & Newspapers | 9.77 | 21.76 |
| R.E.I.T. | 22.72 | 61.43 |
| Real Estate (General/Diversified) | 25.25 | 78.40 |
| Real Estate (Operations & Services) | 14.82 | 32.31 |
| Recreation | 22.59 | 52.06 |
| Reinsurance | 12.92 | 19.18 |
| Restaurant/Dining | 23.53 | 80.25 |
| Retail (Automotive) | 11.56 | 19.84 |
| Retail (Building Supply) | 12.59 | 16.49 |
| Retail (Distributors) | 13.88 | 18.78 |
| Retail (General) | 12.29 | 22.81 |
| Retail (Grocery and Food) | 5.75 | 14.31 |
| Retail (Online) | 33.19 | 83.83 |
| Retail (Special Lines) | 11.40 | 43.75 |
| Semiconductor | 18.04 | 29.30 |
| Semiconductor Equip | 18.69 | 22.86 |
| Shipbuilding & Marine | 10.67 | 30.64 |
| Shoe | 35.83 | 56.49 |
| Software (Entertainment) | 25.09 | 38.04 |
| Software (Internet) | 19.21 | 95.44 |
| Software (System & Application) | 30.42 | 43.93 |
| Steel | 9.74 | 23.06 |
| Telecom (Wireless) | 10.14 | 29.55 |
| Telecom. Equipment | 13.92 | 18.52 |
| Telecom. Services | 6.76 | 13.12 |
| Tobacco | 10.48 | 11.20 |
| Transportation | 12.96 | 25.63 |
| Transportation (Railroads) | 15.46 | 20.93 |
| Utility (General) | 12.15 | 20.53 |
| Utility (Water) | 20.92 | 32.16 |
| Total Market | 20.02 | 36.46 |
Source: Ashwath Damodaran's datasets.
Transaction multiples - Most commonly used formula
EV / Revenue
This is most commonly used to value companies that have negative EBITDA, especially in their startup years, where they generate revenue but not enough to turn a profit. Using this in mature companies, incurring losses may lead to unreliable calculations, so it is important to keep this in mind. This multiple is of high relevance in industries where startups are very common such as tech stocks like Uber, Tesla, etc., who have yet to turn any significant net profit compared to their more mature peers.
EV / EBITDA And EV / EBIT
EBITDA and EBIT are related and include the earnings available to both debt and equity holders. Hence, these are the most widely used multiples across comparable valuations in general.
EBITDA adjusts EBIT for non-cash expenses of depreciation and amortization by excluding their effect and hence is used to compare companies using varying levels of fixed capital (EBITDA ignores the depreciation factor, which increases with an increase in the level of fixed capital).
These multiples work well for companies in industries that are not cyclical and exhibit relatively stable earnings across multiple periods. Hence, these multiples are generally used to value mature companies in a variety of stable industries such as consumer products, retail, and utility.
P/E Ratio
P/E is generally used to value companies in industries where the capital structure used is similar. This is because this ratio can easily be manipulated by capital structure decisions, which do not add any real value to the business.
Also, in industries where different companies of similar sizes use varying capital structures, this ratio will not be stable and unable to provide any real valuation.
Below is a video from our valuation modeling course that discusses how to present the calculated multiples in a football field graph.

Free Resources
To continue learning and advancing your career, check out these additional helpful WSO resources:


or Want to Sign up with your social account?