NPV vs IRR
The former is referred to as the total present value of future cash flows while the latter is the discount rate which makes the former equal to zero
 Du")

What Are NPV and IRR?
NPV and IRR are different methods of Discounted Cash Flow used to evaluate the project's value. Net Present Value shows how much money we can earn over the project life, considering the time value of money (inflation and depreciation). Internal Interest Rate, taking into account the time value of money (inflation depreciation), shows what is the maximum currency depreciation rate we can bear during the project cycle; more generally speaking, what is the maximum annual interest rate we can bear if we go to loan to invest in this project.

In every company's life cycle, a dilemma arises where a choice must be made between different projects. Net Present Value and Internal Rate of Return are two of the most commonly used parameters companies use to decide which investment advice is best.
However, in one project, both criteria give opposite results, i.e., if the net present value method was considered, one project was acceptable. Still, at the same time, the Internal Rate of Return method was more favorable for the other. The conflict between the two is due to differences in project inflows, outflows, and longevity.
Through this article, you will learn the in-depth definition of Net Present Value and Internal Interest Rate, the similarities and differences between them, and the pros and cons of both methods. At the end of this article, there are some practice problems regarding these two methods.
- NPV (Net Present Value) and IRR (Internal Rate of Return) are methods used to assess the value of projects using Discounted Cash Flow analysis.
- NPV calculates the difference between discounted future cash flows and the initial investment cost, accounting for inflation and depreciation. A positive NPV suggests a feasible project.
- IRR is the discount rate that makes the cumulative net present value equal to zero. It indicates the maximum currency depreciation a project can tolerate during its lifecycle, reflecting the maximum interest rate for borrowing.
- NPV and IRR are commonly used to evaluate and compare investment opportunities. Sometimes, projects yield opposite decisions due to differences in cash flows, outflows, and longevity.
What is NPV?
Net Present Value is the difference between the discounted value of future cash flows generated by investment and the project investment cost. The net present value method is the method of evaluating investment options.
This method uses the total present value of the net cash benefit and the net cash investment to calculate the net present value and then evaluates the investment plan according to the size of the net present value.
NPV = Rt/ (1 + i)t
Where,
- NPV = net present value
- Rt = net cash flow at time t
- i = discount rate
- t = time of the cash flow
If the net present value is positive, the investment plan is acceptable; if the net present value is negative, the investment plan is theoretically unacceptable, but in terms of experimental manipulation, this may be inconsistent with the company’s strategic decision-making.
For example, a company’s strategic decision-making process might include supporting other projects, developing new markets and products, and finding more opportunities for greater profits.
The principle on which the net present value method is based on:
Assuming that the expected cash inflow can be realized at the year's end, the original investment is regarded as borrowed at a predetermined discount rate.
When the net present value is zero, the principal and interests are repaid for the remaining income, and nothing is gained. When the net present value is negative, the projected income is insufficient to repay the principal and interest.
This method has a wide range of applicability. The main problem in the application of this method is how to determine the discount rate.
One method is to determine it according to the cost of capital, and the other is to determine it according to the minimum capital profit required by the enterprise.
Advantages and Disadvantages of NPV
The advantages are as follows:
-
Uses Cash Flow. Companies can use the cash flow from projects directly; in contrast, profits contain a lot of human factors. Profit does not equal cash in capital budgeting.
-
The net present value includes all the cash flows of the projects. Other capital budgeting methods ignore the cash flows after a certain period, such as the payback period.
-
The net present value discounts the cash flow reasonably, and some methods tend to ignore the time value of money when dealing with cash flow, such as the payback period method and the accounting rate of return method.
The disadvantages are as follows:
-
It is difficult to determine the cost of capital rate, especially in the case of economic instability. Frequent changes in the interest rate in the capital market also make it more challenging to determine.
-
The net present value method explains the total profit and loss of the investment project. Still, it fails to explain the benefit of the unit investment, that is, the actual investment rate of return of the investment project itself.
This will result in selecting projects with extensive investment and high returns in investment planning and ignoring better plans with small investments, small returns, and high returns on investment.
Considering the risk based on the net present value method, two uncertain decision-making methods are obtained: the affirmative equivalence method and the risk-adjusted discount rate method.
However, the disadvantage of the affirmative equivalence method is that the affirmative equivalence coefficient is difficult to determine, and the operability is relatively poor.
The risk-adjusted discount rate rule mixed time to value and value at risk and discounts cash flows accordingly, which is unreasonable.
In addition, it is impractical to use the single risk-adjusted discount rate determined by the CAPM model. If management decisions are flexible, it is even more inaccurate to use a fixed discount rate to calculate the net present value.
Net Present Value Method: Problems to Avoid
Some problems that we need to avoid are:
-
Determination of the discount rate. Although the net present value method considers the time value of funds, it can indicate that the investment plan is higher or lower than the rate of return of a specific investment. Still, it does not reveal the specific return rate that the plan can achieve. The determination of the discount rate directly affects the selection of the project.
-
The net present value method evaluates multiple investment opportunities in a project. Although it reflects the investment effect, it only applies to the evaluation of mutually exclusive projects with equal years.
-
The net present value method assumes that the net cash flows in each period before and after are obtained at the nest return rate (benchmark rate of return).
-
If the investment project has different risks at different stages, it is best to use different discount rates for discounting in stages.
NPV Example
Suppose two projects, A and B, invest $100,000, the discount rate is 10%, and the expected income and net present value are as follows. (Assume that the project cycle is only five years, unit: $10K)
| Investment: $100,000 | Project A Expected Income | Net Present Value | Project B Expected Income | Net Present Value |
|---|---|---|---|---|
| Year 0 | -10 | -10 | -10 | -10 |
| Year 1 | 1.1 | 1.1/(1+10%)=1 | 2.2 | 2.2/(1+10%)=2 |
| Year 2 | 2.42 | 2.42/(1+10%)^2 = 2 | 4.84 | 4.84/(1+10%)^2=4 |
| Year 3 | 3 | 3/(1+10%)^3 = 2.25 | 4.84 | 4.48/(1+10%)^3=3.37 |
| Year 4 | 5 | 5/(1+10%)^4 = 3.42 | 4 | 4/(1+10%)^4=2.73 |
| Year 5 | 7 | 7/(1+10%)^5 = 4.35 | 3 | 3/(1+10%)^5=1.86 |
| Sum | 1+2+2.25+3.42+4.35-10=3.02 | 2+4+3.37+2.73+1.86-10=3.96 |
As can be seen from the above example, the NPV of project B is higher and more worthy of investment.
The reason is that although the 5-year total income of A and B is equal to 185,200 if the time value of money is not considered, due to the Project B income generated earlier, the net present value of B is higher, and it is more worthy of investment.
From here, we can see that the net present value mainly calculates how much money can be earned after devaluing the impact of currency depreciation.
What is IRR?
Internal Rate of Return means the discount rate when the cumulative net present value is 0. This internal rate of return indicates the rate at which the project can withstand the maximum currency depreciation.
The Internal Rate of Interest is the interest rate that makes the inflow funds' total present value equal to the outflow funds' total present value; in other words, the discount rate that makes the net present value equal to zero.
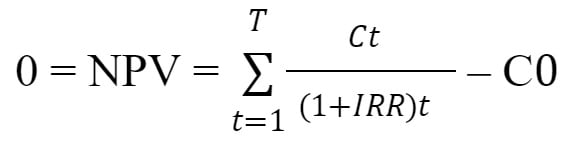
Where,
- Ct = Net Cash Inflow during the period t
- C0 = Total initial investment costs
- IRR = The internal rate of return
- t = The number of time periods
Without a computer, it is calculated using several discount rates until one is found where the NPV is zero or close to zero.
It has some of the characteristics of the DCF method and is most often used to replace the DCF method in practice. Its basic principle is to try to find a numerical value that summarizes the characteristics of business investment.
The IRR itself is not affected by the interest rate of the capital market but depends entirely on the enterprise's cash flow, reflecting its inherent characteristics.
However, this method can only tell investors whether the assessee company is worth investing in, but they do not know how much it is worth investing in.
Moreover, this method has the opposite judgment rule when facing investment-oriented enterprises and financing enterprises:
- For investment-oriented enterprises, when the IRR is greater than the discount rate, the enterprise is suitable for investment
- When the IRR is less than the discount rate, the business is not worth investing in; financing businesses are not
Generally speaking, for investment or M&A, investors not only want to know whether the target enterprise is worth investing in but also want to know the overall value of the target enterprise.
The internal rate of return method cannot satisfy the latter; therefore, this method is commonly applied to single project investment.
IRR Example
Take the above chart as an example, assuming that the discount rate is now 20%, and now calculate the net present value of Project A and Project B as follows:
| Investment: $100,000 | Project A Expected Income | Net Present Value | Project B Expected Income | Net Present Value |
|---|---|---|---|---|
| Year 0 | -10 | -10 | -10 | -10 |
| Year 1 | 1.1 | 1.1/(1+20%) | 2.2 | 2.2/(1+20%) |
| Year 2 | 2.42 | 2.42/(1+20%)^2 | 4.84 | 4.84/(1+20%)^2 |
| Year 3 | 3 | 3/(1+20%)^3 | 4.84 | 4.48/(1+20%)^3 |
| Year 4 | 5 | 5/(1+20%)^4 | 4 | 4/(1+20%)^4 |
| Year 5 | 7 | 7/(1+20%)^5 | 3 | 3/(1+20%)^5 |
| Sum | -0.44 | 0.92 |
It can be seen that the NPV of Project A is negative at this time, while the NPV of Project B is still positive, which means that the IRR of Project A will be less than 20%, while the IRR of Project B will be greater than 20% because the IRR is the discount rate when NPV is 0.
We finally calculated that when the discount rate is 18.45%, the NPV of Project A is just equal to 0; when the discount rate is 23.94%, the NPV of Project B is just equal to 0, as shown in the following table:
| Investment: $100,000 | Project A Expected Income | Net Present Value | Project B Expected Income | Net Present Value |
|---|---|---|---|---|
| Year 0 | -10 | -10 | -10 | -10 |
| Year 1 | 1.1 | 1.1/(1+18.45%) | 2.2 | 2.2/(1+23.94%) |
| Year 2 | 2.42 | 2.42/(1+18.45%)^2 | 4.84 | 4.84/(1+23.94%)^2 |
| Year 3 | 3 | 3/(1+18.45%)^3 | 4.84 | 4.48/(1+23.94%)^3 |
| Year 4 | 5 | 5/(1+18.45%)^4 | 4 | 4/(1+23.94%)^4 |
| Year 5 | 7 | 7/(1+18.45%)^5 | 3 | 3/(1+23.94%)^5 |
| Sum | 0 | 0 |
Advantages and Disadvantages of IRR
The advantages are as follows:
-
The timing of cash flows in all future years is being considered; therefore, each period of cash flow is calculated as equal weight by using the time value of money.
-
It can link the project's lifetime income with its total investment, point out the project's rate of return, and compare it with the industry's benchmark investment rate of return to determine whether the project is worth constructing.
-
It can directly reflect the actual income level of the investment project from a dynamic point of view and is not affected by the industry benchmark rate of return, which is more objective.
The disadvantages are as follows:
-
The internal rate of return method ignores the size of the project. This can be troublesome when two projects need a different capital outlay; smaller projects return a higher IRR.
-
It cannot represent net present value, only ratios. Therefore, the internal rate of return and the net present value must be considered together when reviewing the income plan.
-
The calculation process is complicated, especially when a large amount of additional investment is made during the operation period; it may cause multiple IRRs to appear, either high or low, which lacks practical significance.
Only investment projects whose internal rate of return is greater than or equal to the industry benchmark rate of return or cost of capital are financially viable.
NPV vs IRR
We have already understood what NPV and IRR are and what are the pros and cons of each! But let us understand how both are distinct from each other.
Let us take a look at the main distinction between the two concepts:
| Metric | Net Present Value (NPV) | Internal Rate of Return (IRR) |
|---|---|---|
| Concept | Measures absolute profitability by considering the total cash inflows and outflows | Measures the percentage return on an investment |
| Decision Rule | If NPV > 0, the investment is considered economically viable | If IRR > Cost of Capital, the investment is considered economically viable |
| Multiple Projects | Can be used to rank mutually exclusive projects based on their NPV | May encounter issues when comparing mutually exclusive projects, as IRR assumes reinvestment at the IRR rate |
| Cash Flow Patterns | Works well with conventional cash flow patterns (single initial outflow, followed by inflows) | May lead to multiple IRRs and ambiguity when cash flows change signs more than once |
| Reinvestment Assumption | Assumes cash flows are reinvested at the discount rate | Assumes cash flows are reinvested at the IRR |
From the above table, we can conclude that both NPV and IRR are valuable tools for investment analysis, and they should be used together to make well-informed decisions. NPV provides a clear measure of absolute profitability and is more suitable for comparing mutually exclusive projects.
On the other hand, IRR offers insights into the rate of return an investment can generate, which is particularly useful when evaluating projects against the cost of capital or when assessing the attractiveness of potential investments.
Summary
From the above, we can see that the NPV states how much money we can make during the project cycle considering the time value of money (inflation depreciation), and the IRR states that considering the time value of money (inflation depreciation).
Under the time value of money (inflation depreciation), what is the maximum currency depreciation rate we can bear during the project cycle; more generally speaking, what is the maximum annual interest rate that we can bear if we go for a loan to invest in this project.
For example, the IRR of a project is 20%, which means that the project can withstand a maximum annual currency depreciation rate of 20%; that is, if we take a loan to invest in the project, the maximum annual loan interest rate that we can bear is 20%.
When the actual currency depreciation rate is only 5%, then the remaining 15% will be our profit, although it seems to say that there is room for mistakes (the most I can make mistakes and still break the capital); in fact, can also be considered to mean profit margins and profitability.


or Want to Sign up with your social account?