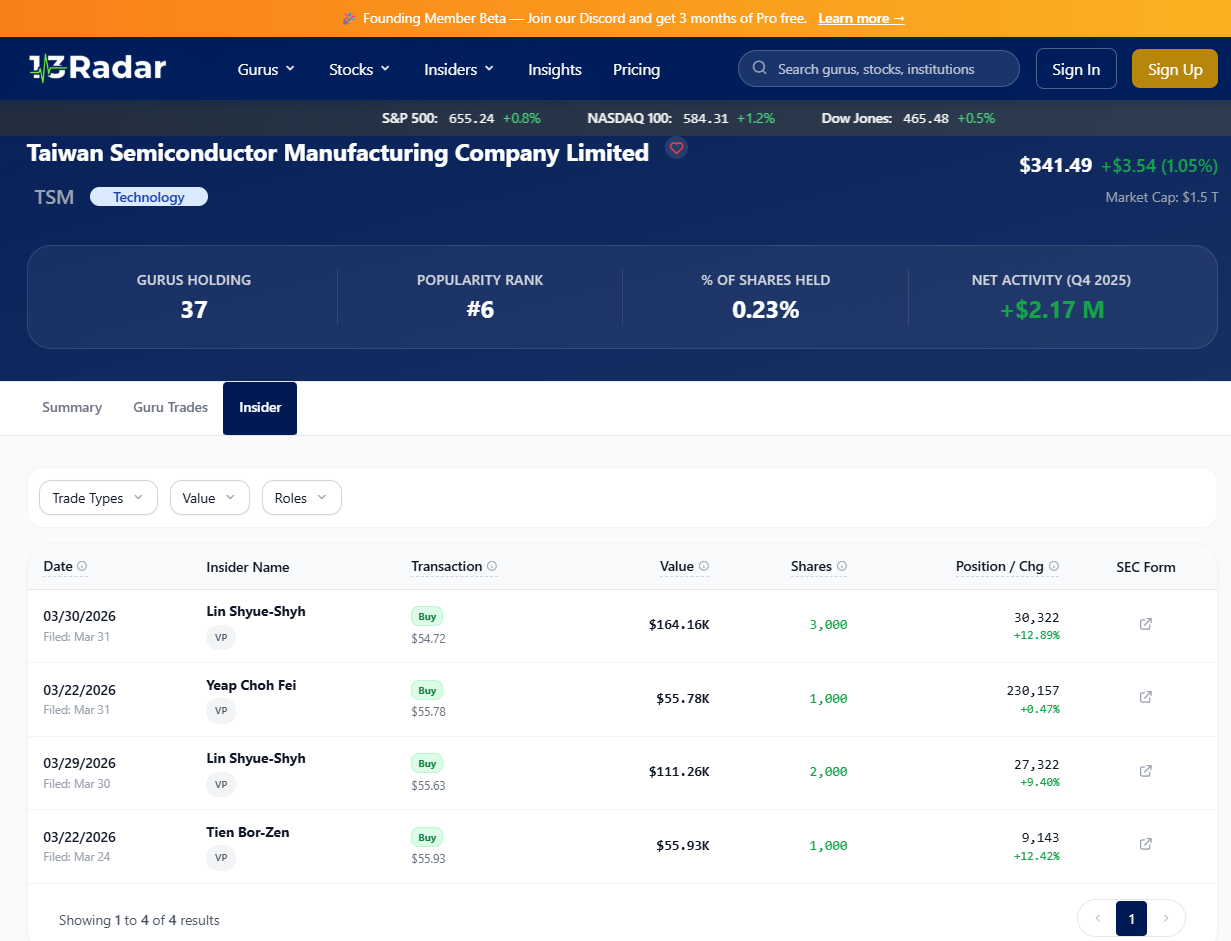
Analyzing Distribution Patterns: Form 4 Outflows and Foundry Cycles
In the highly cyclical semiconductor industry, identifying inflection points requires looking beyond consumer-level narratives and examining quantitative corporate data. For institutional analysts evaluating capital flows, tracking executive equity distributions offers a transparent window into internal corporate perspectives. Rather than serving as prescriptive trading signals, these regulatory filings provide a factual baseline for understanding how leadership teams weigh current valuations against future operational hurdles, particularly in capital-intensive sectors like advanced wafer fabrication.
Contextualizing Macro Tech Liquidity
Evaluating single-firm metrics necessitates a broader sector comparison. Observably, recent Form 4 filings show a noticeable increase in executive sales across major tech companies. This macroeconomic distribution wave establishes a baseline of liquidity extraction among tech leadership, frequently corresponding with extended valuation multiples across the broader index. Analysts utilize this sector-wide context as a control variable when isolating and evaluating company-specific transaction behaviors to determine if a firm is mirroring or diverging from the macro trend.
Evaluating the Foundry Distribution Curve
Against the backdrop of broader sector liquidation, analyzing firm-specific data points becomes an objective exercise in due diligence. By mapping the historical and current TSM insider selling trend, researchers can distinguish between routine compensation structuring, such as pre-planned 10b5-1 tax liabilities, and systematic equity distribution. A sustained pattern of multi-quarter equity reduction by key operational directors typically correlates with internal models projecting anticipated margin compression or a deceleration in downstream demand. This data provides a quantifiable metric for assessing internal risk models without relying on forward-looking public relations guidance.
CapEx Realities and Valuation Modeling
The operational reality of the foundry business involves astronomical capital expenditures, particularly concerning next-generation node development and overseas facility expansion. When executives consistently offload equity during phases of massive corporate infrastructure spending, institutional researchers frequently interpret this as a fundamental recalibration of internal risk assumptions. It highlights the mathematical tension between public valuation premiums and the physical costs of sustaining advanced manufacturing yields. For analysts constructing discounted cash flow models, incorporating these continuous liquidation patterns serves as a strictly objective input to accurately stress-test long-term margin and revenue projections.


Eum qui alias consequuntur beatae doloribus. Dolorem excepturi laborum velit blanditiis suscipit aut. Minima molestiae nihil natus tempore ab dolorum aliquam ut. Quasi qui provident facere consequuntur.
Placeat qui adipisci ratione saepe inventore molestias quia. Sapiente nobis doloribus quibusdam odio consectetur repudiandae distinctio cupiditate. Nihil dolore et facere deleniti non debitis vel. Non voluptatibus dolores qui laudantium.
Distinctio aut maxime nesciunt qui. Suscipit similique laboriosam aut officia non eligendi ab. Cum et est est est consequatur. Excepturi facere necessitatibus veniam corporis voluptas pariatur ut qui. Ab animi velit qui iure.
Et accusantium voluptate ipsam praesentium error. Distinctio reprehenderit explicabo rerum autem esse libero quod. Est porro adipisci quidem.
See All Comments - 100% Free
WSO depends on everyone being able to pitch in when they know something. Unlock with your email and get bonus: 6 financial modeling lessons free ($199 value)
or Unlock with your social account...