Hedging two banks exposed to the European Sovereign Debt Crisis
“Days to save the Eurozone”, then the big rally
A couple of days before Wednesday’s coordinated central bank action goosed global markets, Wolfgang Münchau wrote in his FT ft.com/cms/s/0/d9a299a8-1760-11e1-b00e-00144feabdc0.html">column (“The Eurozone has only days to avoid collapse”) that if the European summit on December 9th didn’t lead to an ambitious three part plan to save the Euro (an ECB backstop + a timetable for a Eurobond + plus an agreement on a fiscal union) the Eurozone risked collapse:
I am hearing that there are exploratory talks about a compromise package comprising those three elements. If the European summit could reach a deal on December 9, its next scheduled meeting, the eurozone will survive. If not, it risks a violent collapse. Even then, there is still a risk of a long recession, possibly a depression.
With that in mind during Wednesday’s rally, I took a look at this Business Insider slideshow of the banks most exposed to the European sovereign debt crisis. Of the ones traded in the US, Banco Santandar, S.A.(STD) and Royal Bank of Scotland (RBS) were among the most exposed, with 11.8% and 12.2%, respectively, of total bank value exposed to European sovereign risk.
Hedging banks exposed to the European Sovereign Debt Crisis
Even after rallying over 11% on the day, RBS in particular was still ludicrously expensive to hedge — too expensive to hedge against any decline smaller than 42%. Seeing how high its optimal hedging cost was, I put in a limit order to buy a few puts on RBS. I didn’t get a fill on them though. The table below shows the costs, as of Wednesday’s close, of hedging RBS and STD against greater-than-42% declines over the next several months, using optimal puts.
Comparisons
For comparison purposes, I’ve also added the cost of hedging the SPDR S&P 500 Trust ETF (SPY), and, because Tim Knight mentioned its significance in a post on Wednesday (“Naughtvember”), the Direxion Daily Bear 3X Energy ETF (ERY) against the same decline. First, a reminder about what optimal puts are, and why I’ve used 42% as a decline threshold here; then, a screen capture showing the optimal puts to hedge RBS.
About Optimal Puts
Optimal puts are the ones that will give you the level of protection you want at the lowest possible cost. Portfolio Armor (available on the web and as an Apple iOS app), uses an algorithm developed by a finance Ph.D to sort through and analyze all of the available puts for your stocks and ETFs, scanning for the optimal ones.
Decline Thresholds
In this context, “threshold” is the maximum decline you are willing to risk in the value of your position. You can enter any percentage you like for a decline threshold when scanning for optimal puts (the higher the percentage though, the greater the chance you will find optimal puts for your position). I’m using 42% as a decline threshold here because, as of Wednesday’s close, RBS was too expensive to hedge against any smaller decline threshold.
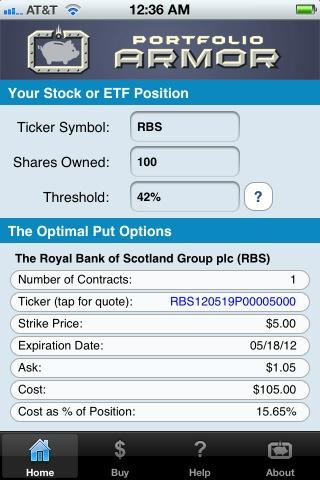
The optimal puts for RBS
Below is a screen capture showing the optimal put option contract to buy to hedge 100 shares of RBS against a greater-than-42% drop between now and March 16, 2012. A note about these optimal put options and their cost: to be conservative, Portfolio Armor calculated the cost based on the ask price of the optimal puts. In practice an investor can often purchase puts for a lower price, i.e., some price between the bid and the ask.
Hedging costs as of Wednesday’s close
The hedging costs below are as of Wednesday’s close and are presented as percentages of position value.
| Symbol | Name | Hedging Cost |
| STD | Banco Santandar, S.A. | 13.4%** |
| RBS | Royal Bank of Scotland | 15.7%* |
| ERY | Direxion Daily Bear 3X Energy | 17.8%*** |
| SPY | SPDR S&P 500 Trust | 0.78%** |
*Based on optimal puts expiring in May, 2012
**Based on optimal puts expiring in June, 2012
***Based on optimal puts expiring in July, 2012


