Modeling Question on Contribution Margin for Volume & Pricing
Hi, hope everyone's doing well. I'm currently practicing modeling through some online materials and wanted to ask a question on a revenue build that is based on a $ and % contribution margin (as below).
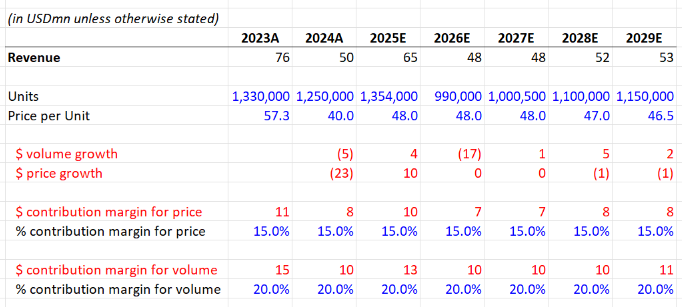
Blue is what's provided (e.g. units and price per unit) and I have to fill in the rest. Red is what I'm confused with or not sure how to approach. Please kindly note all figures are in USDmn except the volume units.
Could I ask if the following formula / approach correct for volume and price growth?
- $ Volume Growth = (Current Period Units Sold – Previous Period Units Sold) * (Previous Period Price per Unit)
- $ Price Growth = (Current Period Price per Unit − Previous Period Price per Unit) * Previous Period Units Sold
- $ Volume Contribution Margin = % Volume Contribution Margin * Revenue
- $ Pricing Contribution Margin = % Pricing Contribution Margin * Revenue
Would highly appreciate your advice / insights. Thank you so much!


Based on the most helpful WSO content, here's how you can approach the modeling question on contribution margin for volume and pricing:
Volume and Price Growth Formulas:
$ Volume Growth: [ \text{Volume Growth} = (\text{Current Period Units Sold} - \text{Previous Period Units Sold}) \times \text{Previous Period Price per Unit} ]
$ Price Growth: [ \text{Price Growth} = (\text{Current Period Price per Unit} - \text{Previous Period Price per Unit}) \times \text{Previous Period Units Sold} ]
Contribution Margin Formulas:
$ Volume Contribution Margin: [ \text{Volume Contribution Margin} = \% \text{Volume Contribution Margin} \times \text{Revenue} ]
$ Pricing Contribution Margin: [ \text{Pricing Contribution Margin} = \% \text{Pricing Contribution Margin} \times \text{Revenue} ]
Additional Insights:
Total Revenue Calculation:
Cost of Goods Sold (COGS):
Gross Profit Calculation:
Gross Margin:
These formulas and insights should help you accurately model the contribution margin for volume and pricing. If you have any further questions or need more detailed explanations, feel free to ask!
Sources: DCF Modeling Course ~ Pre-training text.pdf, DCF Myth 3.2: If you don't look, its not there!, PE interview question - If you can only know 3 things for an investment analysis?, Associate guide on analyzing an income statement
Could you share the online material you’re looking at? Hard to say from photo alone
Not sure what your source material is so hard to answer for sure but this is how I think about it.
Rev growth/contraction in this case is either via price or volume. Your intuition is right to compare change in price or volume and multiply by old volume/price and then the inverse but I prefer to use the new price/vol for the second contribution because then you know you’re going to bridge to the new number (don’t think you do in your first one but others might be ok, always run a check to confirm your contributions = total change like to 0.00 diff). FWIW, I almost always do price first but that’s my personal preference (changes in pricing generally more interesting/insightful to the story for me).
For contribution margin I’d then apply the margin to the calculated contributions. So if price is 5 and margin is 15% then you’d assume your gross profit is up 0.75 related to price move.
Consequatur omnis possimus et rerum laudantium vel. Est nobis voluptas voluptate voluptate. Consequatur animi eos qui placeat. Dolor a repellat in.
Esse quasi illo iure consequatur enim aspernatur. Ex qui aut ut ad labore distinctio vitae laboriosam. Sequi optio ducimus voluptates ut. Consequatur nesciunt unde id similique unde consequatur minus. Perferendis ut aut sunt quibusdam voluptas eius consequatur asperiores.
Accusamus et quod veniam ut. Ducimus ipsum magni molestiae nulla consequuntur voluptatum. Accusamus consequuntur rem molestiae eos sit. Deserunt autem aut eligendi omnis eum.
See All Comments - 100% Free
WSO depends on everyone being able to pitch in when they know something. Unlock with your email and get bonus: 6 financial modeling lessons free ($199 value)
or Unlock with your social account...