IBES Estimates
For each organization, statistical time series were computed using the raw data


What Is the Institutional Brokers' Estimate System (IBES)?
Institutional Broker’s Estimates System (IBES), often written as I/B/E/S, is a database used by the broker and investor community to access the future earnings estimates made by stock analysts about publicly traded companies.
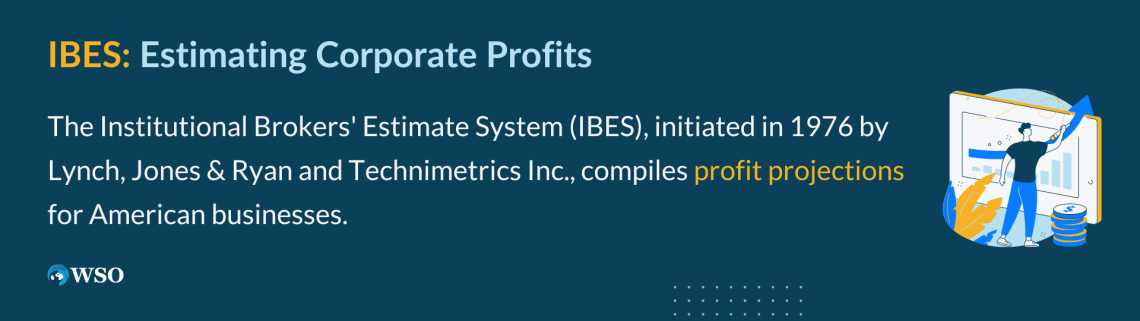
The New York brokerage company Lynch, Jones & Ryan(LJR), and Technimetrics Inc. created the Institutional Brokers' Estimate System (IBES) as a service. Around 1976, IBES started compiling profit projections for American businesses.
LJR was a financial service company that specialized in providing various research and data services to institutional investors.
IBES was created to aggregate all the earnings estimates from the analyst and present them to institutional investors in one place.
For each organization, statistical time series were computed using the raw data.
Later, articles in academic finance journals based on the data were published to show that variations in consensus profit projections could indicate opportunities to generate excess returns in the future.
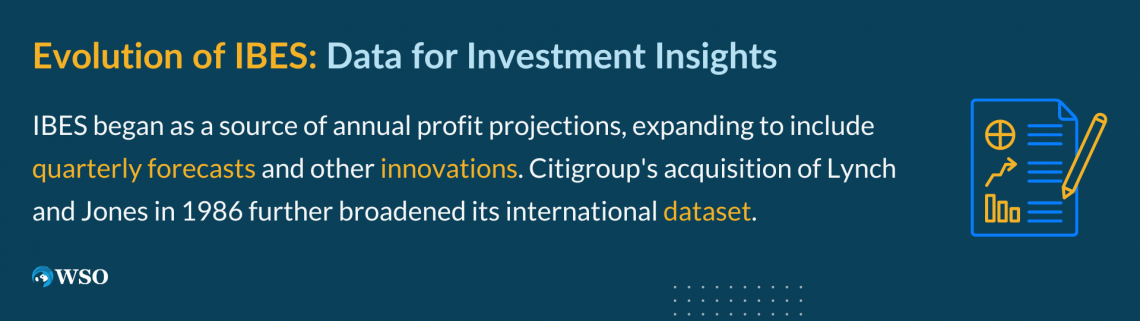
The database was eventually enhanced to include quarterly earnings forecasts after initially including only annual earnings estimates and estimates of "Long Term Growth." In addition, the examination of "Quarterly Earnings Surprises" was made possible.
Other innovations enabled by the data included "top-down" (made by strategists and economists) and "bottom-up" (made by individual analysts) estimates for different equity indices.
It started broadening its dataset in the middle of the 1980s to include businesses abroad. For example, Citigroup purchased Lynch and Jones in 1986.
Barra purchased it in 1993, and two years later, Primark acquired it. Thomson Financial acquired Primark in 2000. Refinitiv is the brand name of the financial segment that the successor company Thomson Reuters split off in 2018.
The database currently covers over 40,000 businesses across 70 marketplaces. In addition, it offers 50,000 institutional money managers as clients.
It receives data from more than 900 companies, ranging from the biggest worldwide houses to small regional and local brokers, with U.S. data going back to 1976 and global data going back to 1987.
The industry benchmark for analyst detail, consensus and aggregate statistics, business guidance data, and sophisticated analytics is Refinitiv Estimates.
The Institutional Brokers' Estimate System, established in 1976, collects and combines the many projections of future earnings for publicly traded businesses given by stock analysts.
- IBES was established in 1976 to compile profit projections for American businesses and has grown into a leading database covering 40,000 equities across 70 markets.
- IBES offers historical estimates, guidance data, and global aggregates, assisting portfolio managers and analysts in making investment decisions.
- The database provides normalized data to address currency volatility, enabling accurate comparisons and predictions.
- Users must be aware of rounding errors and adjustments in the data, with various methods available to handle these issues.
- To access IBES data, users can complete the online query form and select relevant variables for download, requiring careful analysis of the results for informed decisions.
IBES Spinoffs
These spinoffs enable the creation of specialized services and tools tailored to specific market segments, industries, or analysis types.
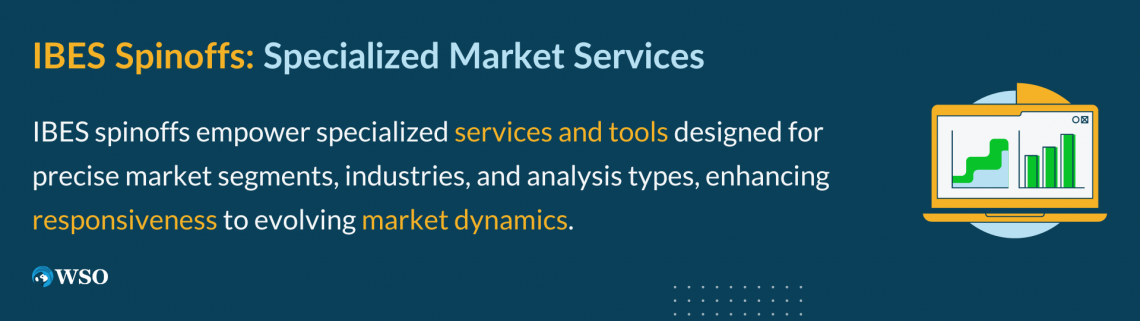
By breaking down the broad spectrum of financial analytics into more focused and agile entities, IBES spinoffs facilitate greater precision and responsiveness to market trends.
Three separate academic subscriptions are available:
- Historical Estimates (forecasts made by third-party analysts for businesses)
- Guidance (management's forecasts for the company)
- Global Aggregates (country forecasts and international indices)
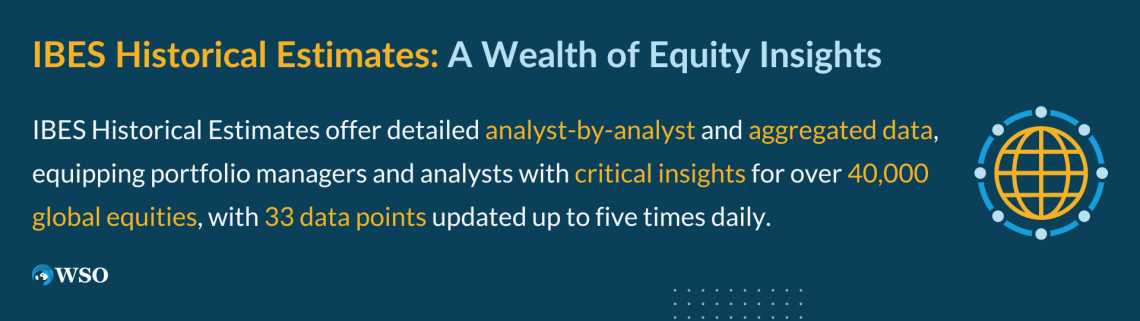
Two major data sources comprise the Historical Estimates:
- Specific History (analyst-by-analyst estimates) and
- Brief History (aggregated estimates).
In addition, a summary (consensus) level and a detailed (analyst-by-analyst) level of the IBES current forecast database are available.
It is made to assist portfolio managers and analysts locate, alter, and analyze extraordinary information for over 40,000 equities globally. It also includes over 33 data pieces updated as frequently as five times daily.
The only historical estimate database in the industry with statistically meaningful historical data is Its History.
Its History began in 1976 for U.S. projections and in 1987 for global forecasts. It comprises data on more than 45,000 businesses across 70 markets and offers a rare chance to backtest investment ideas under various global market scenarios.
This research can confidently predict future outcomes by comparing current market conditions and historical tendencies.
The earnings estimate history is available in two formats: Summary and Detail.
A monthly snapshot of the consensus level data makes up the Summary History. The worldwide edition began in 1987, although the U.S. edition began in January 1976 with reported profit predictions and results.
This timeline of specific analysts' earnings projections is called the Detail History (Analyst Earnings Estimate History) (daily records at the analyst level). While the international edition debuted in 1987, the American edition debuted in 1983.
Both sets of data are accessible for U.S. and foreign stocks. The databases cover 56 nations and 70 markets.
Normalized Vs. Regular data
Due to previous currency volatility, T.R. developed normalized historical files, which comprise summary and detailed data with normalized business default currencies, starting with the April 2009 vintage.
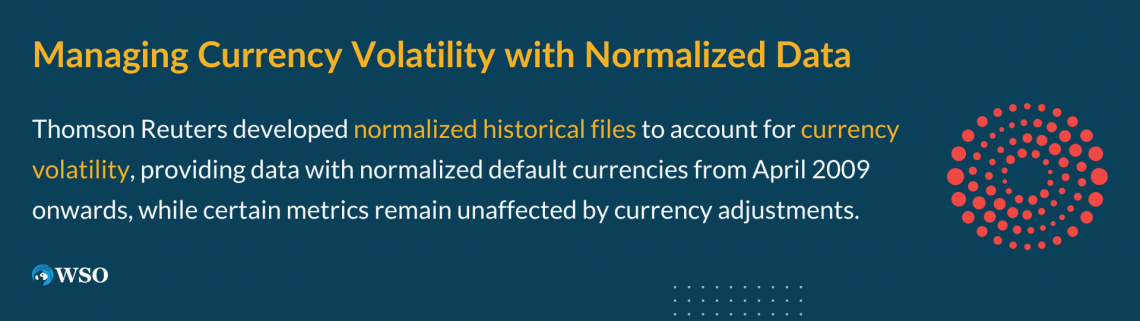
All estimates and actuals will be included in the normalized files in the default currency as of the most recent tape cutoff date.
Thomson Reuters first covered ABC in January 2001. Then, the corporation had USD insurance. Then, however, analysts began offering forecasts in EUR.
T.R. thereby made EUR the default currency. Before March 2008, Detail and Summary Files showed all estimates and actuals were in USD.
Beginning with the March 2008 vintage, ALL previously provided estimates in USD will be converted to EUR using the most recent company default currency and the closing exchange rate on the business day before the estimated date.
Since the following metrics— Gross Margin (GRM), Recommendations, ROA, and ROE are not impacted by currency, normalized files won't be offered for those metrics.
How IBES Estimates are Used
More than 18,000 individual analysts, representing 980+ contributions from over 90+ established and emerging nations, are the most in the sector.
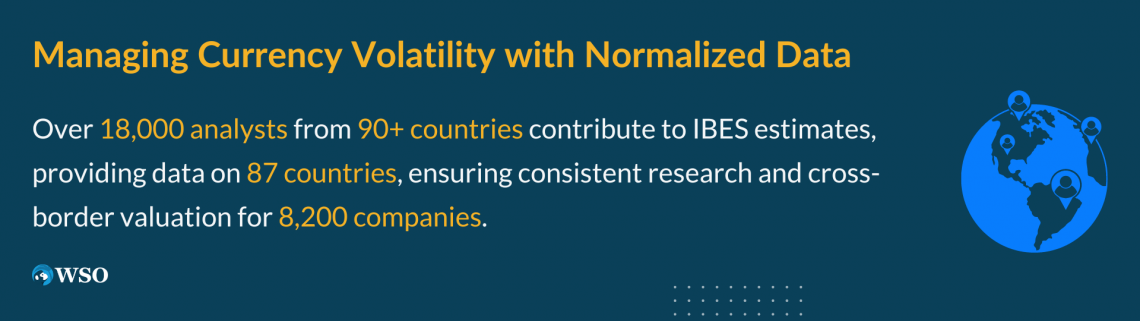
The Global Aggregates Extract includes earnings estimates, related data for 87 countries, and critical international indexes, including the following:
- Sector and industry aggregation
- Cross-border valuation
- Derivatives.
With the confidence that they are utilizing the same accounting basis for consistent research, The Guidance Directly analyzes analyst and management estimates on company performance for over 8,200 companies.
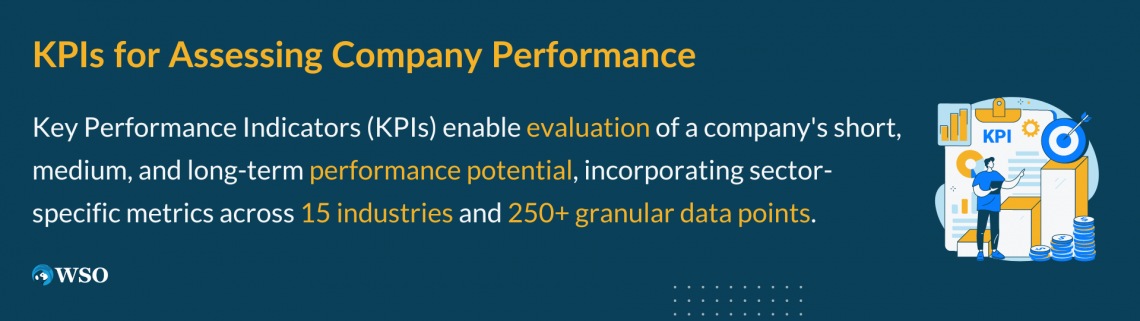
The Key Performance Indicators (KPI) efficiently assess a company's medium- and long-term performance potential. KPIs make it possible for academics to assess a company's short, medium, and long performance.
Deep, sector-specific operating metrics are incorporated into your research using key performance indicators (KPIs). KPIs are accessible for 15 industries and 250+ granular metrics, including Same Store Sales for restaurants and stores.
It has been demonstrated that StarMine SmartEstimates is a better predictor of upcoming earnings surprises than conventional mean estimates.
The proprietary technology is straightforward but effective: it weighs recent contributions and analysts with a proven track record for that firm.
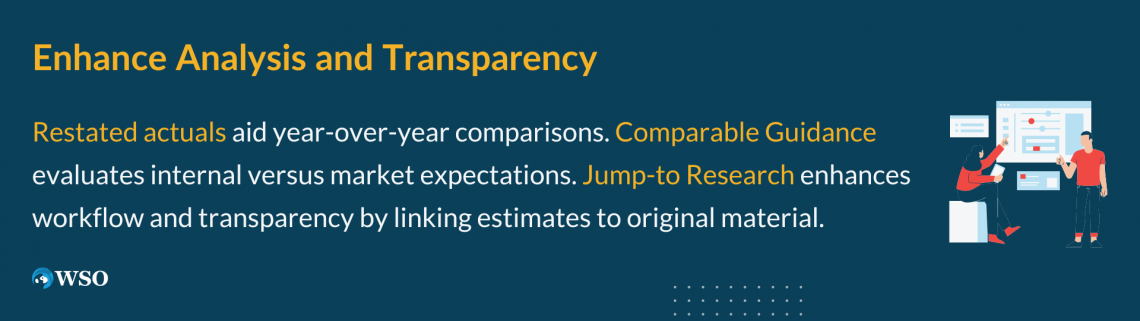
For businesses that restated results, restated actuals provide an accurate year-over-year comparison.
Comparable Guidance contrasts the company's internal expectations for future success with those of the market.
Jump-to Research streamlines client workflow and increases transparency by connecting the detailed estimate directly to the original material.
With more than 30 years of experience, Macro-Level Views - Global Aggregates enables top-down research to more accurately evaluate prospective growth, risk, and future value across the industry, sector, index, country, and region.
To get a summary and individual analyst forecasts of business earnings, estimations, and recommendations, explore IBES on WRDS.
Use IBES Global Aggregates, Key Performance Indicators (KPI), and Guidance to improve your study.
Empirical Issues with IBES estimates
There are several empirical issues in IBES that analysts may encounter. Some of them are:
- Consistency of Data: Different analysts and institutions use different reporting methods to report their estimates. As a result, IBES data may come from different sources, which leads to discrepancies in the data.
- Missing Data: Missing data can be a significant hurdle, especially when small-sized firms are considered.
- Data Revisions: The database can be continuously revised as new information becomes available. Any researcher must be able to incorporate these revisions effectively, as they may affect the accuracy of historical data.
- Forecast Horizon: Some analysts may provide forecasts for a shorter time duration while others may provide it for a longer time duration. It can become difficult to match the projection duration for the research.
- Coverage Bias: Some sectors may be extensively in the IBES dataset while others may not. There will always exist a bias for the coverage of specific industries.
- Analyst Quality: Not every analyst will write a quality report since all are not equally skilled and experienced. When using the IBES data, ensure that you assess the quality of reporting using their past estimates.
Some other problems in IBES with their solution
Some other problems that you might encounter in IBES are:
- Dates for announcements: Ensure that financial announcement dates in IBES are accurate and reliable. You can check several sources to validate the data to minimize the errors related to announcement dates
- Announcement (ANNDATS) vs. activation (ACTDATS) date: Announcement date and activation date need to be clearly distinguished in the analysis to avoid confusion.
- Differences between IBES and Compustat Note on Review Date EPS Actuals (REVDATS): IBES data and Compustat or any other database must be compared cautiously. There may exist differences in the datasets and hence must be adjusted for analysis accordingly.
In the past, IBES has offered modified forecast data, rounded to 2 decimal places on the Summary files and four decimal places on the Detail files.
Adjustment and the related rounding are applied to the full-time series for a particular security.
When Summary files are utilized, the rounding problem is worse. Since the researcher cannot "un-adjust" the data, it implies a zero forecast error.
The adjustment problem gets worse as the split factor goes up.
A quick search of CRSP reveals that from January 1975 to September 2009, 528 equities underwent more than 16-for-1 splits, 215 stocks underwent more than 32-for-1 splits, and 66 stocks underwent more than 64-for-1 splits.
According to Payne and Thomas (2003), samples with stock splits (i.e., larger firms, higher M/B, stronger performers, etc.) are more likely to impact study findings than samples without stock splits.
The percentage of zero forecast mistakes over time about firm characteristics is the subject of the study, which also examines zero forecast error levels.

Inferring earnings management based on the distribution, it adjusts to the probability of zero forecast mistakes over time by assessing the market's response to zero forecast error.
It is helpful to know the true historical numbers that are not adjusted for subsequent stock splits or unadjusted data to produce split-adjusted data without rounding to the next cent.
An alternative is to recalculate consensus statistics using the detailed adjusted data if unadjusted data cannot be available (rounding to 4 decimals).
How to Download Data from IBES
The steps are the following:

Step1: You will need to access the IBES Web Query Form. It is recommended to check the WRDS access help to get connected.
Then pick IBES from the Subscriptions menu. Select Summary History and Summary Statistics under Academic.
Step 2: Complete the online query form.
Step 3: Enter the date range.
Step 4: Enter company codes, add a text file or perform a database search (see detailed instructions).
Uncheck Fiscal Year 1 (1) and choose Quarter 1 in the Forecast Period Indicator (FPI) box if you want the analyst estimates for the upcoming quarter (6).
Step 5: Choose which variables to include in the download. It is preferable to start with the next option from:
- IBES Ticker CUSIP Official Ticker (8-Digit)
- Name of the company
- Forecast Period End Date (the date at the end of the period the estimates are being provided for)
- Financial period (the date the analysts were surveyed for this data, typically once a month)
- The number of estimates
- Detail Actuals File, Median, Estimate Mean, and Estimate Actual Value
- Date of Actual Announcement, taken from the Detail Actuals File (the date the actual values were announced)
Step 6: Choose a query output, such as an Excel spreadsheet (*.xlsx) or any form you need in step 6. Then you can hit "Submit Query" and click the link to open the file after downloading.
Step 7: Analyze the Results
It is important to analyze what you get from step 6 because there may be several estimates for the same period. That is mainly due to frequently surveyed analysts, who used to survey once every month.
Most of the researchers with whom we collaborate using the projections generated on the most recent date to the actual values' announcement.


Researched and authored by Xinyue Xu
Reviewed and edited by Parul Gupta | LinkedIn
Free Resources
To continue learning and advancing your career, check out these additional helpful WSO resources:


or Want to Sign up with your social account?