DEVSQ Function
An Excel Statistical Function that is utilized by users to calculate the sum of the squared deviations from the sample mean from a data set.


What is the DEVSQ Function?
The DEVSQ function is an Excel Statistical Function that is utilized by users to calculate the sum of the squared deviations from the sample mean from a data set.
DEVSQ function os most frequently used in Microsoft Excel, is a formula for taking the sample mean of a dataset to calculate the deviation (DEV) of the squares (SQ).
In some cases, like finding the total sum of the deviations of squares, it would be crucial to use the DEVSQ function. However, in other cases that may not need the variables for calculation, the DEVSQ function is unreliable.
Another commonly used function is the SUMIFS function in Excel, which finds the total sum of a given dataset.
The SUMIFS function can be located under the Math & Trig tab or simply inputting “=SUMIFS.”
The article will continue to discuss the function's formula, a component breakdown of the formula, and an Excel sheet example.
The example will detail a scenario using the DEVSQ function and a follow-through series in navigating the function.
- The DEVSQ function is an Excel Statistical Function used to calculate the sum of squares of deviations from the mean in a dataset.
- The syntax for the DEVSQ function typically includes one or more arguments representing the dataset of numerical values. It returns the sum of squares of deviations as a single numerical value.
- The DEVSQ function may return an error if the dataset contains no numerical values or all values are non-numeric. In such cases, it may return a #VALUE! An error indicates that the calculation cannot be performed.
- The DEVSQ function first calculates the mean (average) of the dataset, then calculates the squared deviation of each data point from the mean, and finally sums up these squared deviations to obtain the total sum of squares of deviations.
DEVSQ Function Formula
The formula required in calculating the squares deviation is as follows:
DEVSQ(number1, [number2])
Further breaking down the DEVSQ formula, let’s take a closer look at the components that formulate the calculation.
First, the “number1” variable of the DEVSQ function is the numerical variable of the given dataset. The first variable or number is required as it will help return the intended calculations of the squared deviations.
Similarly, the “number2” variable is the continuation of the first variable. However, as noted in the formula above, “number2” is an optional input.
The function must include numerical values, as it calculates the sum of all chosen numbers. The example in the next section will depict how the function is used.
How to use the DEVSQ Function in Excel?
In the example below, five values are used to determine the sum of all values presented.
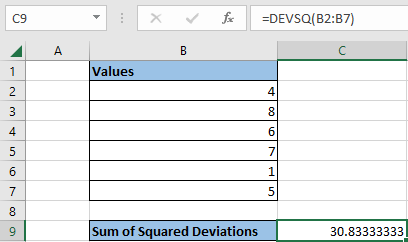
In this example, a dataset of six values is inputted into the Excel table to demonstrate how the DEVSQ function can calculate the sum of the given values.
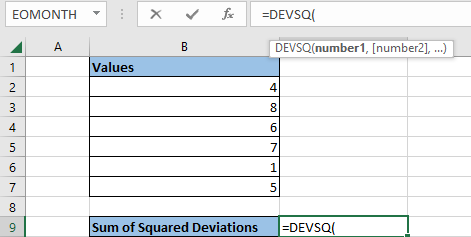
After all necessary data is inputted into the Excel sheet, you can calculate its sum of squared deviations. Then, to navigate the DEVSQ function, you can simply type in the “Sum of Squared Deviations” table, i.e., “=DEVSQ,” and the function should appear.
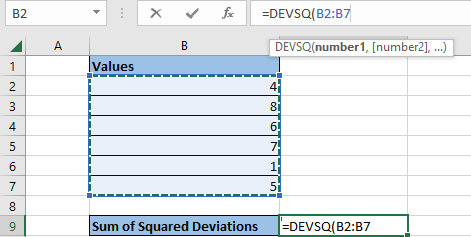
After double-clicking the DEVSQ function, you may highlight, in this example, the six given values in cells B2 through B7.
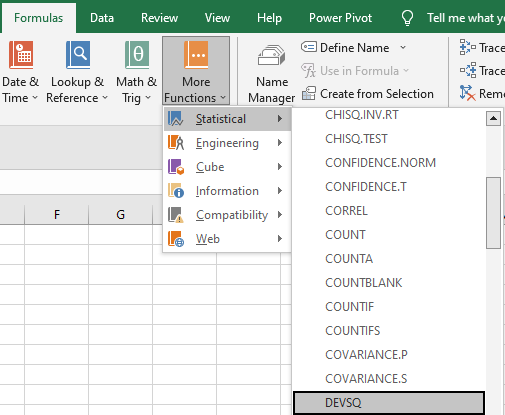
Another way to locate the function is to follow the steps as directed in the instructions:
- In the Excel sheet, locate the Formulas tab at the top bar.
- Click on More Functions.
- In the dropdown bar, you will see six additional categories. Click on Statistics.
- Another dropdown bar will appear with functions in alphabetical order. Simply scroll down and locate “DEVSQ.”
Going back to the example, the highlighted cell C9 returns a sum of the squared deviations to be about 30.83. Also, located in the upper right-hand corner, the DEVSQ function is demonstrated to use the given values.
The squared deviation function can determine its sum by taking all the dataset values.
If you receive an error presenting #NUM! or #VALUE!, please consider the following situations:
- Inputting non-numerical data such as text.
- Inputting of special characters or letters that do not read as a numerical set.

Free Resources
To continue learning and advancing your career, check out these additional helpful WSO resources:


or Want to Sign up with your social account?