F.INV.RT Function
An Excel Statistical function that uses the F-probability distribution to determine the right-tailed inverse.


What is the F.INV.RT Function?
The F.INV.RT function is an Excel Statistical function that uses the F-probability distribution to determine the right-tailed inverse. The function proves to be of great importance in determining the critical values from F-distribution.

The F.INV.RT function is most commonly used when there is a need to compare two data sets in F-tests
The F.INV distribution function is closely related to the returns. The formula used for both F.INV.RT and F.INV contain the same components, and an inverse is determined.
The difference is the specific return of the right-tailed probability distribution.
Furthermore, if you wish to obtain more accurate results, the F.INV.RT function is not recommended when calculating a matrix. Other Excel functions may be more suitable for a larger dataset, but the F.INV.RT function specializes in the F probability distribution.
The formula, its component breakdown, and the F.INV.RT example will be discussed throughout the remainder of the article. The F.INV.RT example will go into greater depth on how to utilize and navigate the computation.
- The F.INV.RT function in Excel is used to calculate the inverse of the cumulative distribution function (CDF) of the F-distribution. It is the value for which the F-distribution cumulative distribution equals a given probability.
- The F.INV.RT function is used in statistical analysis to find critical values in hypothesis testing, such as in ANOVA (Analysis of Variance) and regression analysis.
- The F.INV.RT function returns the inverse of the F-distribution cumulative probability for the given probability and degrees of freedom.
- It is essential in statistical analysis to determine critical values in hypothesis testing and regression analysis.
F.INV.RT Function Formula
The calculation in determining the right-tailed inverse is as follows:
F.INV.RT(probability, deg_freedom1, deg_freedom2)
In breaking down the components of the F.INV.RT function, let’s determine the uses and importance of each variable.

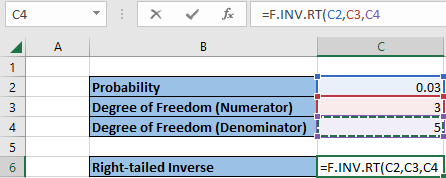
First, the “probability” component is an important and required aspect of the F.INV function. This is because the data for the probability variable comes from the F probability distribution.
Second, the “deg_freedom1” considers the degree (deg) of freedom of the numerator associated with the F.INV function. The “deg_freedom1” is also a required aspect of the function.
Lastly, the “deg_freedom2” considers the degree of freedom of the denominator. Similar to the first two components, the “deg_freedom2” is a required part of the function as it is included in the overall computation of the inverse.
Continue exploring the formulas and functionalities of Excel with our learning courses at Wall Street Oasis.

Example Of F.INV.RT Function
In the example pictured, a probability distribution of 0.03 receives the following answer.
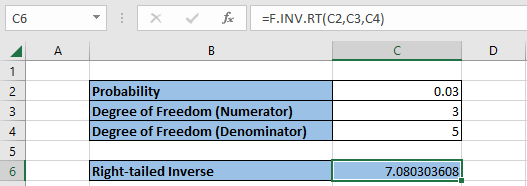
With all required data inputted in the table above, the right-tailed inverse equals 7.080303608. As highlighted in cell C6, the F.INV.RT function is demonstrated to include datasets C2, C3, and C4.
As mentioned previously, the degrees of freedom represent the values of the function located on the numerator and denominator, which are also required factors for calculating an accurate inverse.
After entering all necessary data within the table of an Excel sheet, you can locate the function in two different ways. One way is to simply locate the desired cell that you would like to input the function’s returns.
In this example, the F.INV.RT function is located in the table categorized as “Right-tailed Inverse.”
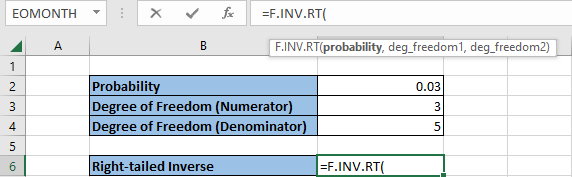
Then, type “=F.INV.RT,” and the function should appear promptly. Following that, you can now highlight the cells with the necessary data to include in the computation.
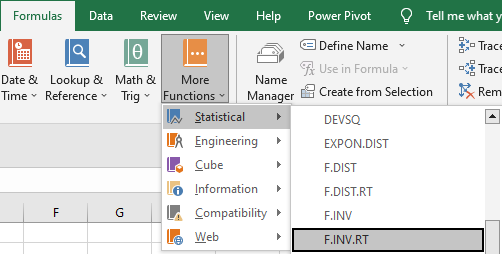
Another way to locate the F.INV.RT function is to follow the steps as directed in the instructions:
- In the Excel sheet, locate the Formulas tab at the top bar.
- Click on More Functions.
- In the dropdown bar, you will see six additional categories. Click on Statistics.
- Another dropdown bar will appear with functions in alphabetical order. Simply scroll down and locate “F.INV.RT.”
If the right-tailed inverse returns a #NUM! or #VALUE!, consider the following scenarios that may cause an inaccurate result:
- First, the probability component is not between zero and one.
- The degree of freedom of the numerator and denominator is less than one.
Remember to input all datasets as numerical values to receive accurate results.

Free Resources
To continue learning and advancing your career, check out these additional helpful WSO resources:


or Want to Sign up with your social account?