OFFSET Function
A versatile Excel function allowing one to reference a range of cells relative to a starting point cell


What Is The OFFSET Function In Excel?
Offset is an Excel function that allows users to reference cells dynamically. The Offset function is a versatile tool allowing one to reference a range of cells relative to a starting point cell. Its fluid nature makes Offset particularly useful in finance, wherein data points and formulae are subject to change regularly.

A key application would be the creation of flexible budgets that can automatically update themselves as new observations are entered. Similarly, the function can help project future cash flows by instantly recording any changes made through components of the CF statement.
The Offset function can make dynamic named ranges when dealing with vast business datasets.
This is beneficial because the named reference can adjust its size and alter itself if new data is added to the spreadsheet. In addition, it simplifies the user experience by only updating the named range formula rather than manually adjusting each formula text in the data.
Amongst specific business applications, Offset provides a convenient method for conditional formatting. For example, it can shift a reference or formatting rule the user sets based on new criteria desired on the spreadsheet.
Let’s assume someone inputs a condition where the background color of the cell changes if sales are below a certain threshold; management may decide to change the sales threshold to a higher value.
In that case, slightly higher sales entries that were previously blank would have a colored background due to the Offset function.
Key Takeaways
- The OFFSET function in Excel allows users to reference cells dynamically, making it particularly useful in scenarios where data points and formulas change regularly.
- OFFSET facilitates the creation of flexible budgets that automatically update as new data is entered, and it aids in projecting future cash flows by instantly recording changes in components of the cash flow statement.
- The function is valuable for creating dynamic named ranges in vast business datasets, adjusting their size and content as new data is added to the spreadsheet, streamlining user experience.
- To use the OFFSET function in Excel, users can find it in the formulas tab or type its syntax directly. The function's syntax, involving parameters like reference, rows, cols, height, and width, allows for versatile data extraction and manipulation, making it a powerful tool in Excel.
How to use OFFSET Function
To find the Offset function in Excel, one must navigate to the formulas tab and click the Lookup drop-down to find OFFSET; an alternative is simply typing the function's syntax in an empty cell.
Various components make up the syntax for Offset. It can be entered as follows:
=OFFSET(reference, rows, cols, [height], [width])
where,
- Reference: Typically, the title of the data column or row being fetched
- Rows: Shows the horizontal movement of the function
- Cols: It looks at how the function moves vertically
- [height]: number of rows for the desired data output (negative height input will be to the left of the reference cell while the positive height will be on its right)
- [width]: number of columns for the final data field
For instance, if the rows input is 0, Offset searches for data in the same row. Similarly, an input of 3 would cause a three-row shift below the reference, whereas an input of -3 has the opposite effect (three rows above the reference).
A Cols of 0 would scout for observations in the same column, while positive or negative inputs will shift the desired output to the right or left of the reference column.
The height & width inputs work together to form the final data field; for instance, an entry of height 1 and width 1 would return one cell.
However, a -3 height and -2 width create a matrix that consists of three rows and two columns. Since the commands are negative, they will be on the left of the reference cell (a height or width of 0 cannot be entered).
Note
One should keep the reference cell relevant when using the Offset function. As data in the spreadsheet keeps changing, it is possible that the previous reference used might return an invalid function (#REF! Error).
OFFSET Examples in Excel
To illustrate the Offset function working in real-time, an arbitrary example of sales data is taken.
Let’s assume Company A records its sales every day of the week. Then, one can deduce the total of Monday sales over four weeks using Offset.
The commands used for Company A’s Monday sales are broken down below:
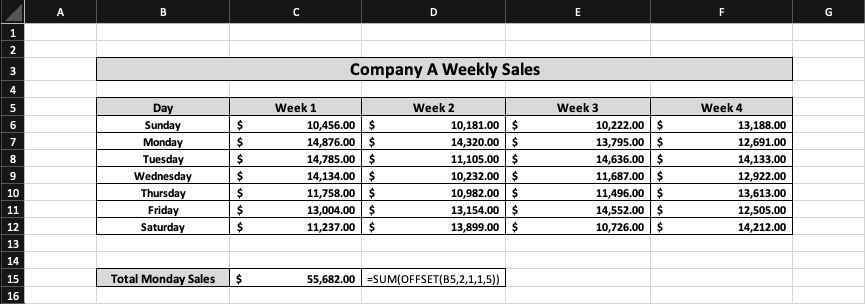
- The reference cell is set as the Day column because Total Monday Sales is the desired output.
- The rows input is 2, aiming to select Monday by going two rows below the reference.
- A cols input of 1 is required as the Week 1 sales data is one column to the right of Monday.
- By entering a height of 1 and width of 5, the final data field would have one row and five columns encompassing Company A Monday Sales every week (C7:F7).
- To compute Total Monday Sales, one must embed the SUM function into Offset to add all the weekly sale numbers.
- Hence, the final function syntax would be “=SUM(OFFSET(B5, 2, 1, 1, 5)),” which gives a total of $55,682 for Company A’s total sales across four weeks on Monday.
- In case an average of Company A’s Monday Sales is needed, the syntax can be changed to “=AVERAGE(OFFSET(B5, 2, 1, 1, 5)).” The function inputs stay the same, but AVERAGE is overlaid instead of SUM.
However, there is an inconsistency in the formula, which must be addressed. The width is written as 5, while there are only four weeks of Monday sales data because new sales data will be added weekly.
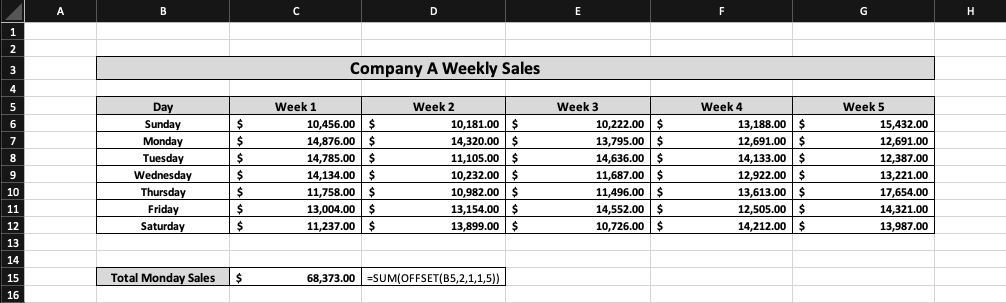
To account for the addition of new data, it is common practice to extend the width to blank cells, which will be populated in the future.
This is important as it eliminates the need for further editing of the Offset function, allowing total Monday sales to be dynamically calculated when new weekly sales data is added. For example, adding Week 5 sales data for Company A can describe the following circumstance.
Notice how the Offset function has not been edited, but the Total Monday Sales dynamically changed to $68,373 as new Week 5 data was added for Company A Sales.
The above phenomenon is why OFFSET is preferred to regular functions such as AVERAGE or SUM because the formula does not need to be adjusted as new entries are added.

Another Example
While the previous example focuses on data with column headers, knowing how Offset is used for data with row titles is imperative.
An example of this data structure is depicted below using quarterly Asset Turnover numbers for Company B:
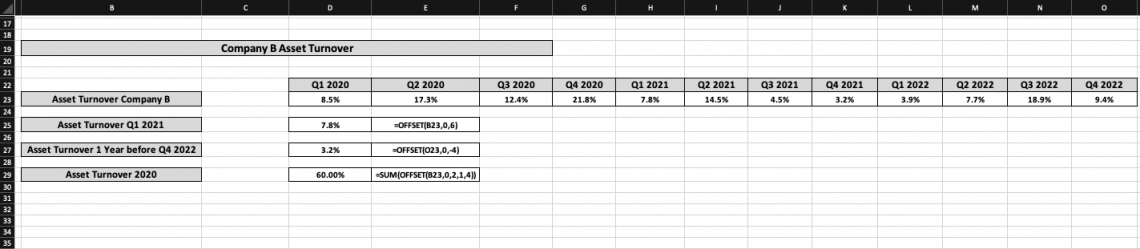
- When looking for the Asset Turnover in Q1 2021, the syntax would be “=OFFSET(B23, 0, 6),” which corresponds to 7.8%.
- The reference cell is entered as ‘Asset Turnover Company B,’ the row's title formatted data. Since there is a single row, one must enter a row input of 0; a cols input of 6 will shift the desired output of six cells to the right to end up in Q1 2021.
- If the Asset Turnover one year before Q4 2022 is desired, the function will change as, in this case, Q4 2022 is the reference cell.
- Hence, the new syntax would be “=OFFSET(023, 0, -4),” which returns a Q4 2021 turnover of 3.2%. A cols input of -4 is entered to move back a year (leftwards), and one year comprises four quarters.
- The Offset function must include height and width to find the Asset Turnover for an entire year since a data field with multiple values is required.
- The SUM function must be added to OFFSET to add 2020 quarterly values. Therefore, the syntax must be “=SUM(OFFSET(B23, 0, 2, 1, 4))” to give a cumulative asset turnover of 60% for 2020.
The reference cell is set as the data title; a row input of 0 is needed because one searches for data in the same row. For cols, the input is 2, as this would make the function move two places to the right in Q1 2020.
Before entering the height and width, one must understand that 0 rows and 2 cols will provide the starting point for the desired data field (Q1 2020). A height of 1 and a width of 4 return one row and four columns beginning in Q1 2020.
Now that the data field of Q1 2020 to Q4 2020 can be selected, all that is left is to add them up using the SUM function on top of the pre-existing OFFSET command.
As new data is added, one can toggle regarding relevant results without making wholesale changes to the function's syntax.
Importance of OFFSET Function
The versatility and adaptability of the Offset function make it an incredibly appealing option for dynamic datasets across various industries.
It can be combined with other Excel functions to produce interesting results. For example, adding Offset to the MATCH function will yield an output similar to Index Match.
Replacing the height and width arguments with the COUNTA function makes it possible to create a flexible named range that excludes empty cells, improving the sheet's functionality.
What makes this function stand apart is that Offset is essentially a GPS for a dataset, it provides a starting point in the form of a reference cell, and one can navigate how many rows (up or down) or columns (across left or right) to move before selecting a range of data.
There are many unique ways to use this function to arrive at a desired outcome. In addition, it does not rely on any specific formula making it easier to attach Offset with other Excel formulas.
To conclude, the time required to sift through vast datasets is enormous. Hence to navigate through the noise, one needs a powerful tool such as the Offset function to pinpoint a certain value or set of values.


or Want to Sign up with your social account?