
T.DIST Function
It calculates the value of the Student's T-Distribution


What is T.DIST Function?
The T.DIST function is one of the statistical functions in Excel. It calculates the value of the Student's T-Distribution.
Excel is a popular spreadsheet software tool that helps businesses and working professionals store data efficiently. Excel provides us with many functions that make complex mathematical tasks easy.
Excel also allows us to make charts and graphs, helping to interpret data visually and intuitively. Excel is a user-friendly spreadsheet software as it automates complex mathematical calculations, so we do not have to do them manually, saving time.
These features make Excel an essential tool in the industry for storing data efficiently and for performing complex tasks on the data to draw reliable insights and conclusions.
- The T.DIST function is a statistical function in Excel used to calculate values of the Student's T-Distribution.
- The student’s t-distribution is a continuous distribution that expresses the standard normal distribution in a generalized form.
- The T.DIST function syntax in Excel consists of three arguments: x (the value at which to evaluate the distribution), deg_freedom (the degrees of freedom), and cumulative (a logical value indicating whether to return cumulative distribution).
Types of Excel Functions
Excel provides us with different categories of functions, like
1. Financial Functions
Finance is the most essential part of any business. Without adequate financial resources, no company can run smoothly in the long run. Financial Functions in Excel help to manage a company's financial activities and resources.
They are used to get insights into the company's financial condition to generate more profit. Information such as the cost-to-profit ratio and the debt amount can be obtained using financial functions. Excel's financial functions are the PMT, PPMT, and IPMT functions.
2. Statistical Functions
Statistical Functions are used when dealing with a probability distribution and its statistical implications. These functions can perform simple calculations on a data set's mean, median, and mode and much more complex calculations of different probability distributions.
These can also be used to perform statistical tests and analyses. Some statistical functions in Excel are the NORMINV function, NORM.S.INV function, and CHISQ.INV function.
Each function has its applications and usage based on the different kinds of probability distribution.
3. Scientific Functions
Trigonometry and logarithms are widely used when dealing with scientific data and calculations. Excel provides us with many functions to perform scientific calculations like SIN(), COS(), and TAN().
Excel also provides functions to calculate the inverse, like SINH(), COSH(), and TANH().
It also provides logarithmic functions like LN() and LOG10().
There are many more types of functions in Excel, which makes it useful software. In this article, we will discuss the T.DIST function, a statistical function in Excel.
Understanding the T.DIST Function
The T.DIST function is one of the statistical functions in Excel. This function calculates the value of the Student's T-Distribution. In statistical terms, the student’s t-distribution is a continuous probability distribution that expresses the standard normal distribution in a generalized form.
This distribution is symmetric, about zero, and graphically represented in a bell shape, similar to the standard normal distribution. This distribution is used for testing hypotheses on small data sets. It also helps in machine learning for linear regression analysis.
The Student’s T-Distribution is also used to construct Confidence Intervals between two population means. It also plays a significant role in statistical analysis processes like the Student's t-test for analyzing the statistical significance between two sample means.
The probability density function(pdf) of this distribution is continuous, as shown below:
Here:
- t is the continuous random variable,
- v refers to the number of degrees of freedom and
- Γ (greek letter, capital gamma) is the gamma function
In the above formula, if the value of v tends to be infinity, the distribution becomes the standard normal distribution.
The formula of the T.DIST function in Excel is as follows:
=T.DIST(x, deg_freedom, cumulative)
The terms in the parentheses are the arguments the function requires to perform the computations.
Note
In financial analysis, the T.DIST function is used for portfolio risk analysis to examine a portfolio's risk and return relationship. This function was added to Excel in 2010; thus, earlier versions of Excel do not contain it.
The T.DIST function requires the following three arguments to do the calculations:
- x: This numeric argument refers to the value of the continuous random variable at which we intend to evaluate the student’s t-distribution.
- deg_freedom: This argument refers to the number of degrees of freedom with which the distribution has to be characterized.
- cumulative This argument refers to a logical value that determines the form of the function. The T.DIST function returns:
- Cumulative distribution function, if cumulative is TRUE(or 1)
- Probability density function, if cumulative is FALSE(or 0)
Examples of the T.DIST Function in Excel
Having looked at all the theoretical concepts and formulas related to the T.DIST function, let us now see some examples to understand and appreciate the practical applications of this function in Excel.
Let us see example 1:
Let us assume hypothetical data in which the continuous random variable(x) at which we intend to calculate the student’s t-distribution is 2. The number of degrees of freedom of the distribution is 6, and the cumulative value is TRUE. The data looks as illustrated below:

We intend to evaluate the cumulative distribution function for the above data using the T.DIST function in Excel. We use the following formula to get the desired result:
=T.DIST(C4, C5, C6)
On using the above formula in cell C7, we get the desired result as shown below:
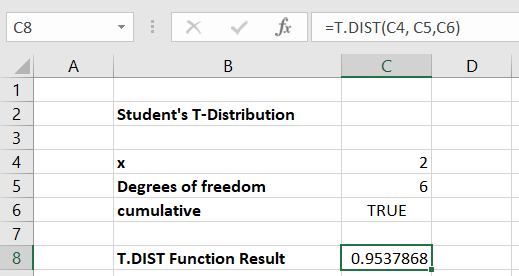
Hence, we get the cumulative distribution function of the Student’s T-Distribution as 0.9537868 or 95.37868%.
Set the cumulative value to FALSE to generate the probability density function based on the given data.
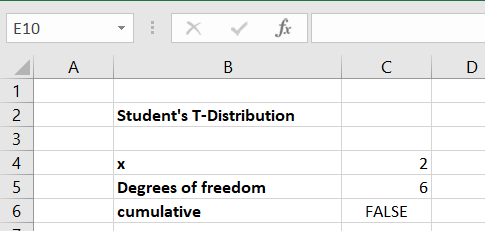
We apply the following formula to determine the probability density function for the data mentioned above using the T.DIST function
=T.DIST(C4, C5, C6)
On using the above formula in cell C7, we get the following result:
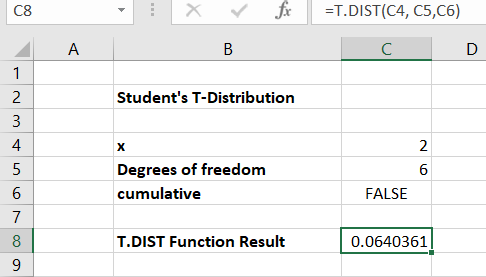
Hence, we get the probability density function of the above student’s t-distribution as 0.0640361 or 6.40361%.
In this way, we can calculate the cumulative density function or the probability density function of any student’s t-distribution, depending on the value of the argument cumulative, the value of the random variable, and the number of degrees of freedom known.
Types of Errors in the T.DIST Function in Excel
The T.DIST function in Excel may return different error values in specific cases. Here are the possible error values and their explanations:
1. #NUM! Error
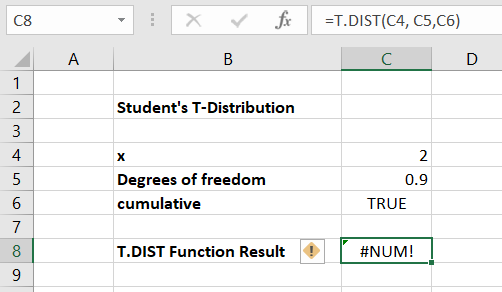
The T.DIST function returns this error in two cases. They are as follows:
a. Case 1
If the cumulative value given is TRUE(or 1), and the number of degrees of freedom of the distribution is less than 1, the T.DIST function returns the #NUM! Error.
b. Case 2
If the cumulative value is FALSE(or 0), and the number of degrees of freedom is less than 0, the T.DIST function returns the #NUM! Error.
2. #VALUE! Error
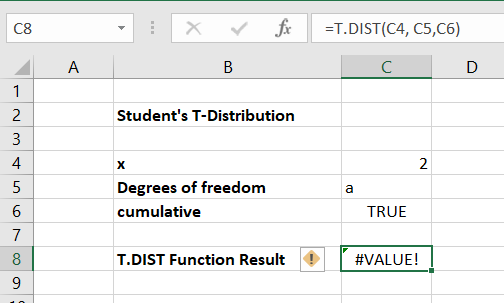
If the given arguments, the value of the random variable, or the degrees of freedom of the distribution is non-numeric, the T.DIST function returns the #VALUE! Error.
3. #DIV/0 Error
When the given cumulative value is FALSE, and the degree of freedom is equal to 0, the T.DIST function returns the #DIV/0 Error.




or Want to Sign up with your social account?