Secondary Axis
An additional axis on an Excel graph aids in visualizing data in another dimension.


What Is A Secondary Axis in Excel?
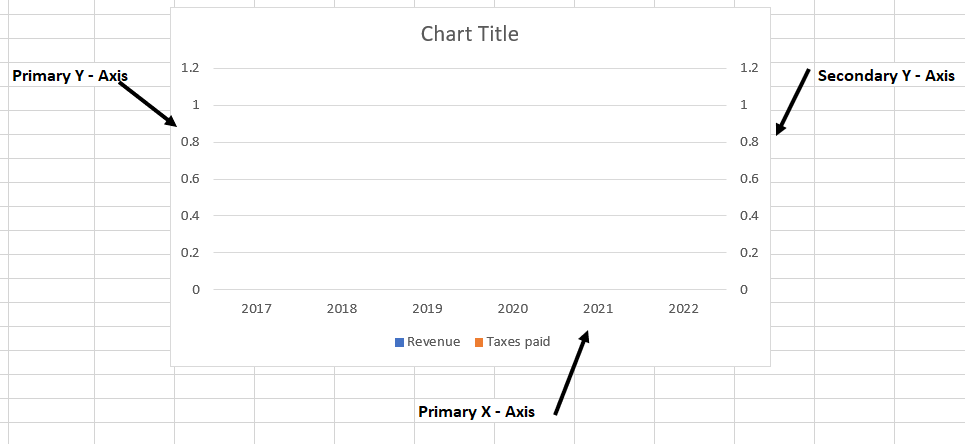
A secondary axis is an additional axis on an Excel graph. It helps to visualize data in another dimension. A secondary Y-axis runs along the right side of the graph, while a secondary X-axis runs along the top.
It allows a user to plot multiple data sources on the same graph without the need for additional charts or graphs. This is an efficient use of space and turning data into information in financial modeling.
Secondary axes are useful when two data series are related but cannot be compared on a single primary Y-axis. It allows you to present related information in a single graph when you need two charts to deliver the same data.
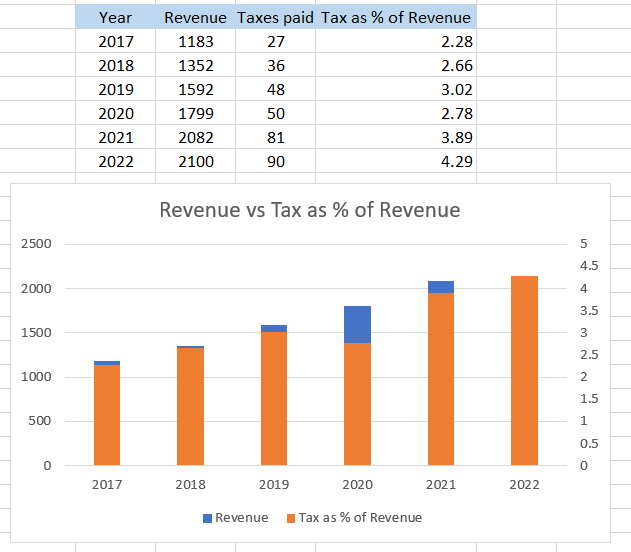
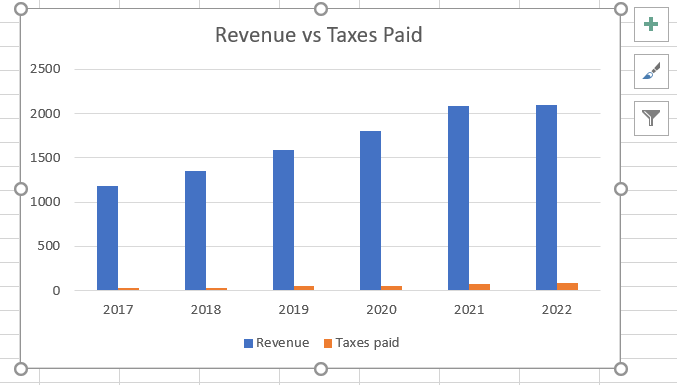
For example, assume that you are plotting revenue for the last five years on the chart along with taxes paid each year.
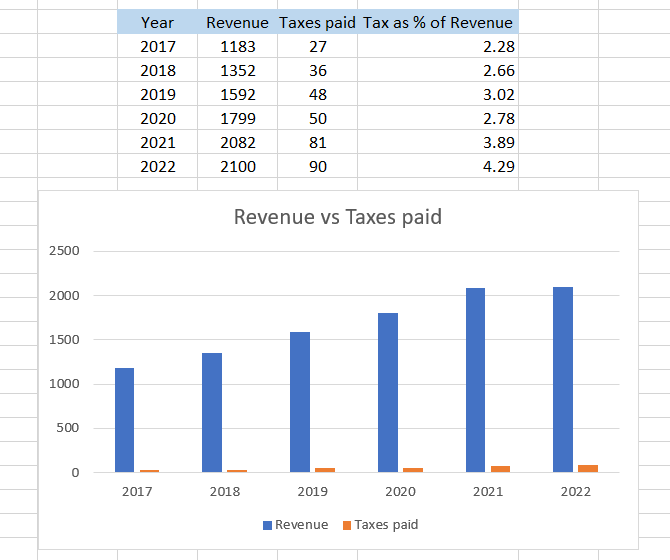
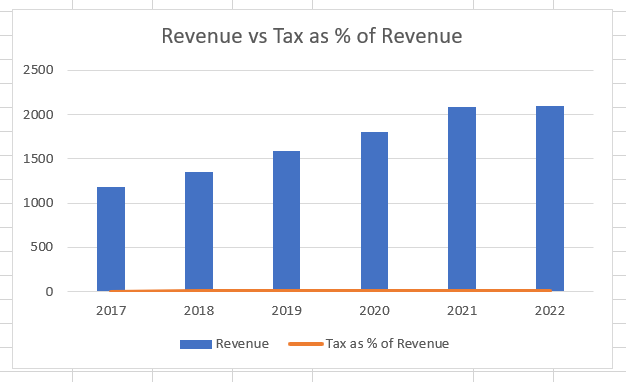
Looking at the example chart above, taxes paid are hardly visible on the bar graph.
Imagine if we had wanted to better display taxes as a percentage of revenue. This would also look a little wonky using the current axes. But with a secondary axis, we can more effectively communicate this information to the observer.
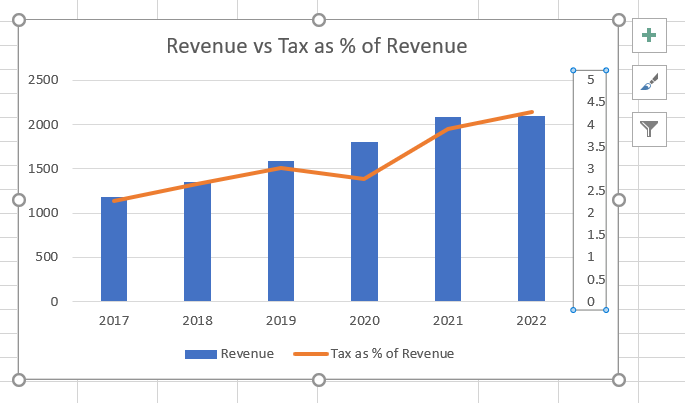
Here the chart shows two different Y axes - the one on the left (default) and the other on the right (secondary axis).
The left axis portrays the revenue for each year, ranging from $0 to $2500 million, while the other shows the taxes paid, ranging from $0 to $100 million. Even though both values are measured in US dollars, the difference in the magnitude of the values is quite large.
- In Excel charts, a secondary axis is an additional vertical or horizontal axis that allows for plotting data series with different scales or units on the same chart.
- The primary purpose of a secondary axis is to facilitate the comparison of two or more data series with significantly different ranges of values.
- A secondary axis is commonly used when plotting data series that represent different units of measurement (e.g., the temperature in Celsius and Fahrenheit) or when comparing data with widely varying magnitudes.
- A typical example of when to use a secondary axis is when plotting sales revenue and profit margin on the same chart. Revenue may be in thousands or millions, while profit margin is typically a percentage, requiring different scales.
How to Add a Secondary Axis in Excel?
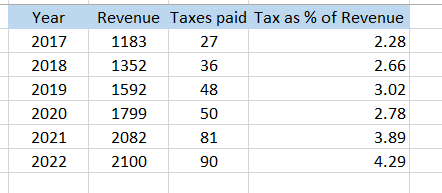
Here is the data for revenue earned by company ABC from 2017 to 2022, along with the taxes paid and taxes as a percentage of revenue.
The steps are as follows:
-
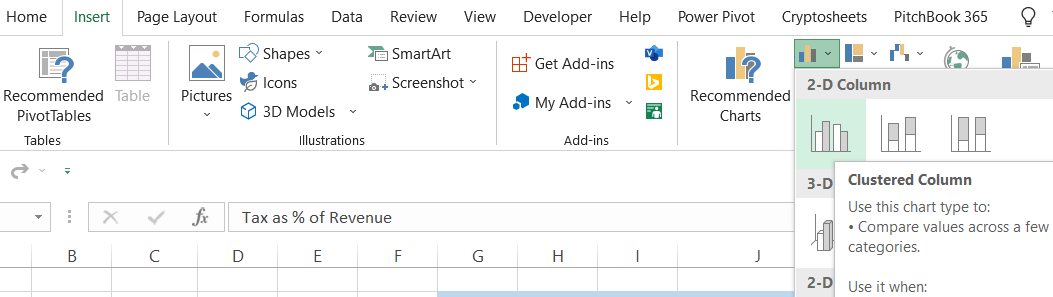
Firstly, select the data then go into Insert and then into the charts section to select the 2-D Clustered Column chart. You can also use the keyboard shortcut of Alt + N + C after selecting the data.
-
Initially, your chart will look as illustrated below:
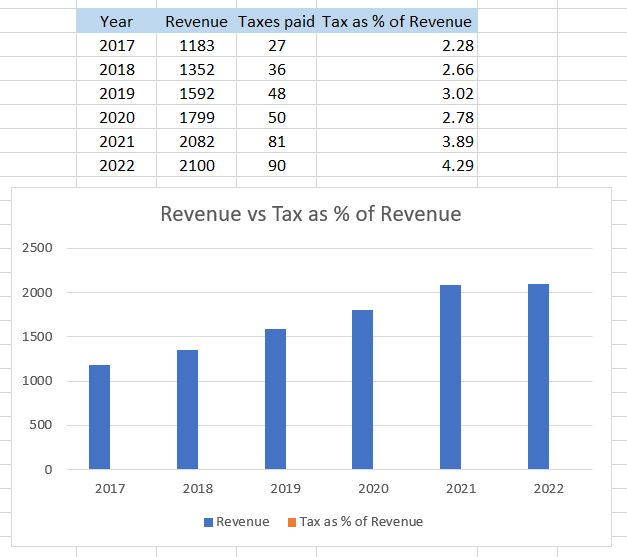
we only have a single primary axis on the left side.
-
Next, we will select the chart and change the chart type to a combo chart:
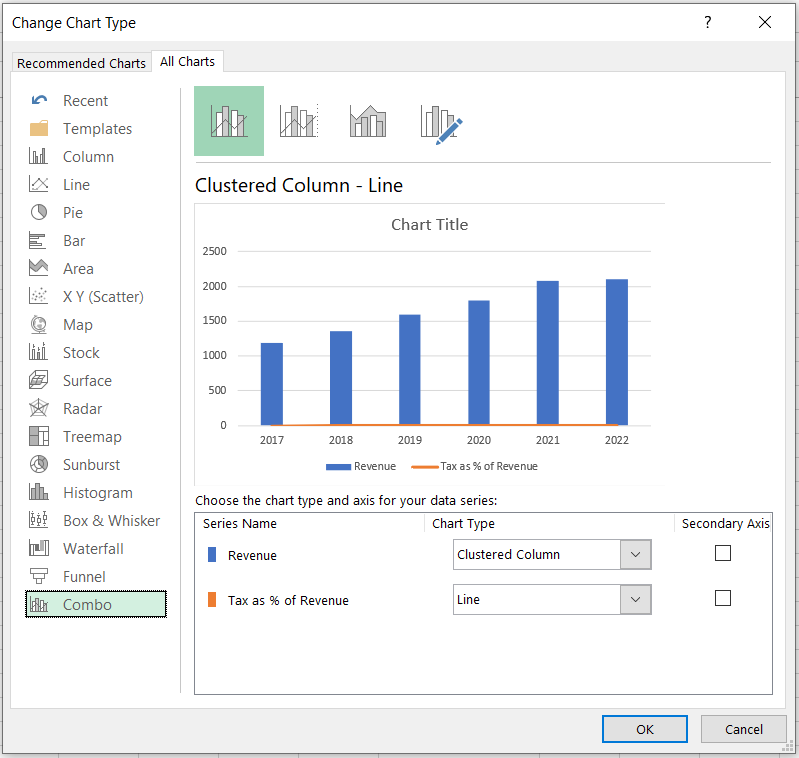
Here, you can keep the Revenue series as a ‘Clustered Column’ chart type while changing the Tax as % of Revenue as a ‘Line’ chart.
-
The tick box lets you add it to your chart. Tick the box for ‘Tax as % of Revenue’ and then click on Ok.
-
After adding it, our chart will now look as follows:
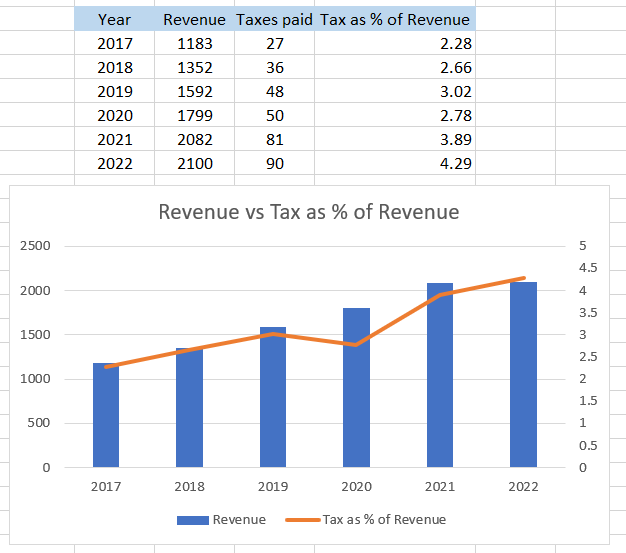
The scale for both axes matches the respective magnitude of data represented in our chart.
-
Since you know that Excel can perform the same task differently, there is another way to add it without changing the chart type for the data.
-
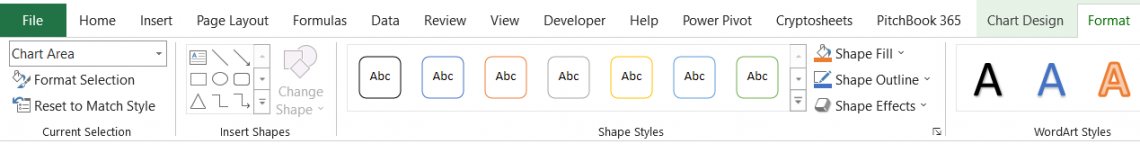
Click on the chart and then the format menu you will see in the menu tab.
-
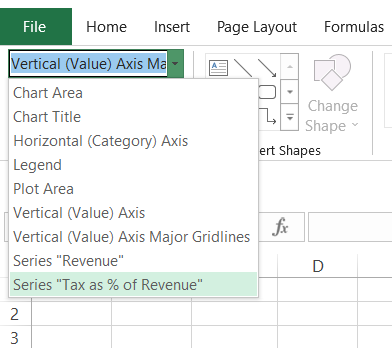
Next, click on the drop-down menu above the ‘Format Selection’ and select ‘Series “Tax as % of Revenue.” Whatever data series you need to represent on the secondary axis will be set here in case of multiple data series.
-
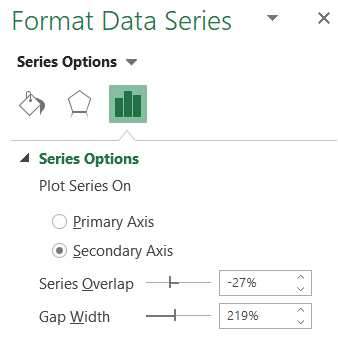
To the right side of Excel, you will find the Format Data Series option, where you need to select the radio box for ‘Secondary Axis’
-
After you make the changes, the chart will look like this:
We get the same result, the only difference being our chart for the ‘Tax as % of Revenue.’ is 2-D ‘Clustered Column’ as well. What method you use to add it is really up to you and the preference for the chart selection for different data series.

Removing the secondary axis
Sometimes, you might not need it after a thought change after initially adding it. So how do you remove it from your chart? Well, it's as simple as just using the delete button. But first, you need to select the secondary axis on the graph.
Now, press either Delete or the Backspace key on the keyboard. Voila! The chart changes back to its default mode, having a single primary axis.
Adding a secondary horizontal axis
We have already discussed how we can add a secondary Y-axis to our charts. Can we do the same for the secondary X-axis as well? Let's see! The steps that you will be following to add a secondary horizontal axis in your chart are:
-
First & foremost, the essential rule to adding a secondary horizontal axis is that you must have already added a secondary vertical axis (Y-axis) in your chart.
-
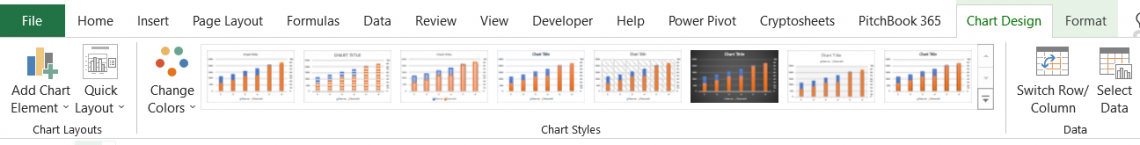
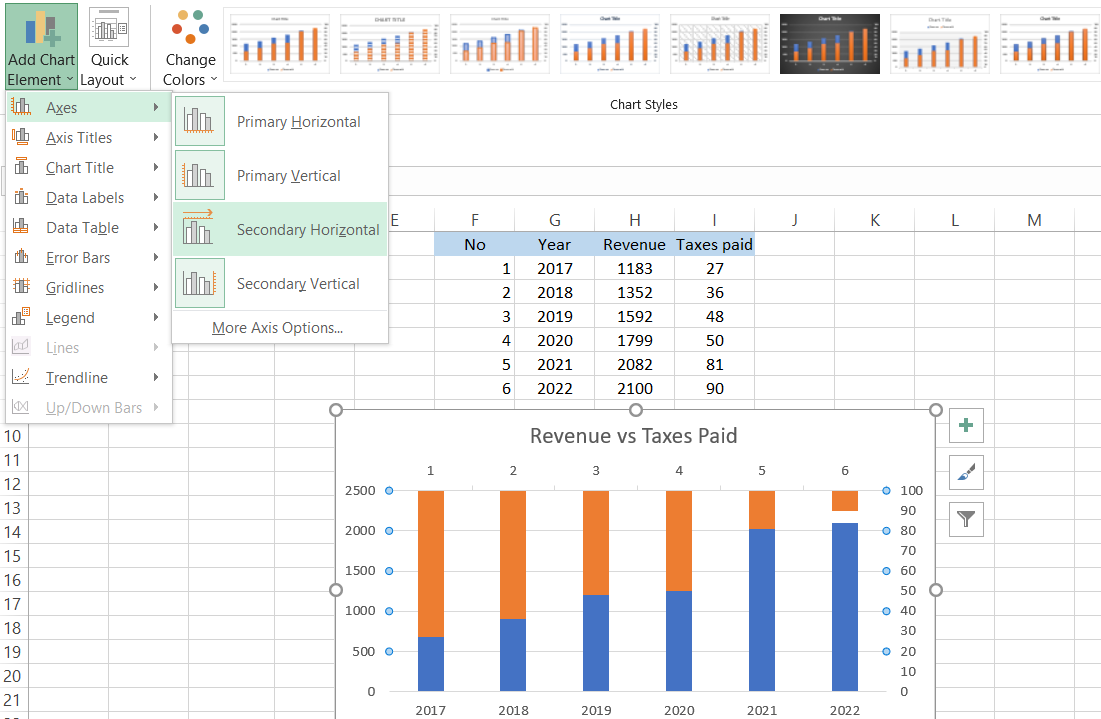
Now, select the chart and click on ‘Chart Design’ in the Menu tab to find the ‘Add Chart Element’ in the Charts Layouts section.
-
After clicking on ‘Add Chart Element, navigate through the drop-down menu and click on Secondary Horizontal in ‘Axes’ to add a horizontal axis on the top of the chart.
-
This way, you can add a vertical axis on either side (Y-axis) and a horizontal axis on either top or bottom(X-axis).
Changing the chart data
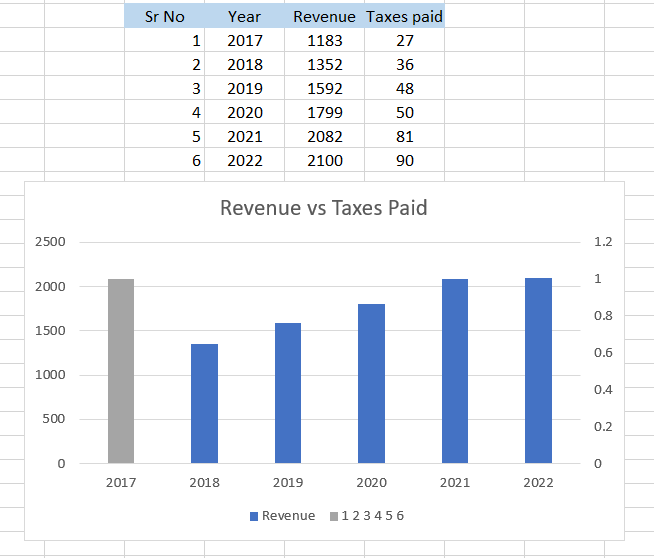
Sometimes the chart might take in incorrect data for either X or Y axes, which can cause data analysis and visualization issues. The easiest solution is to change the data rather than add the charts repeatedly. For example, assume that the chart represents serial numbers instead of the taxes paid.
To change this, you can follow the below steps:
-
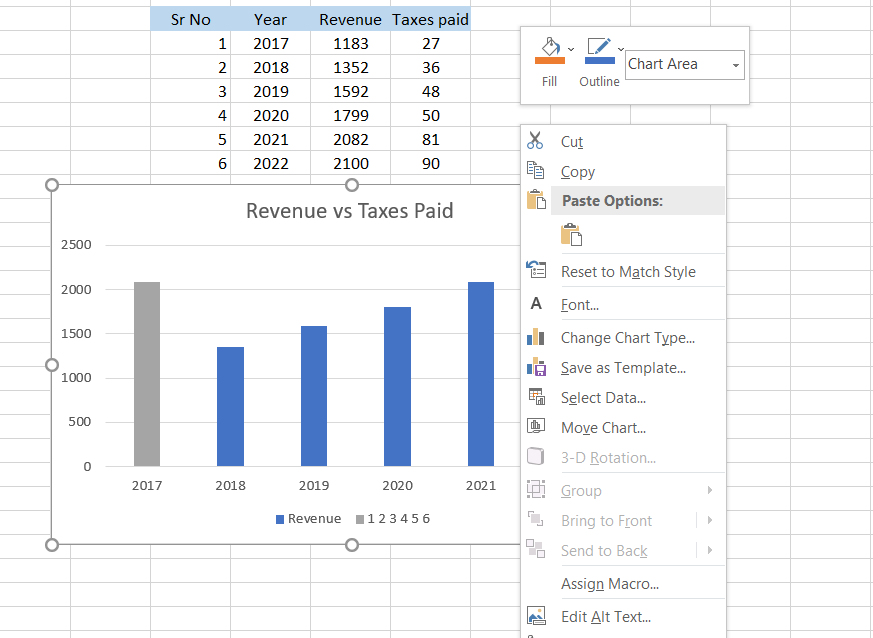
Select the chart & right-click on it to open the menu where you need to click on ‘Select Data.’
-
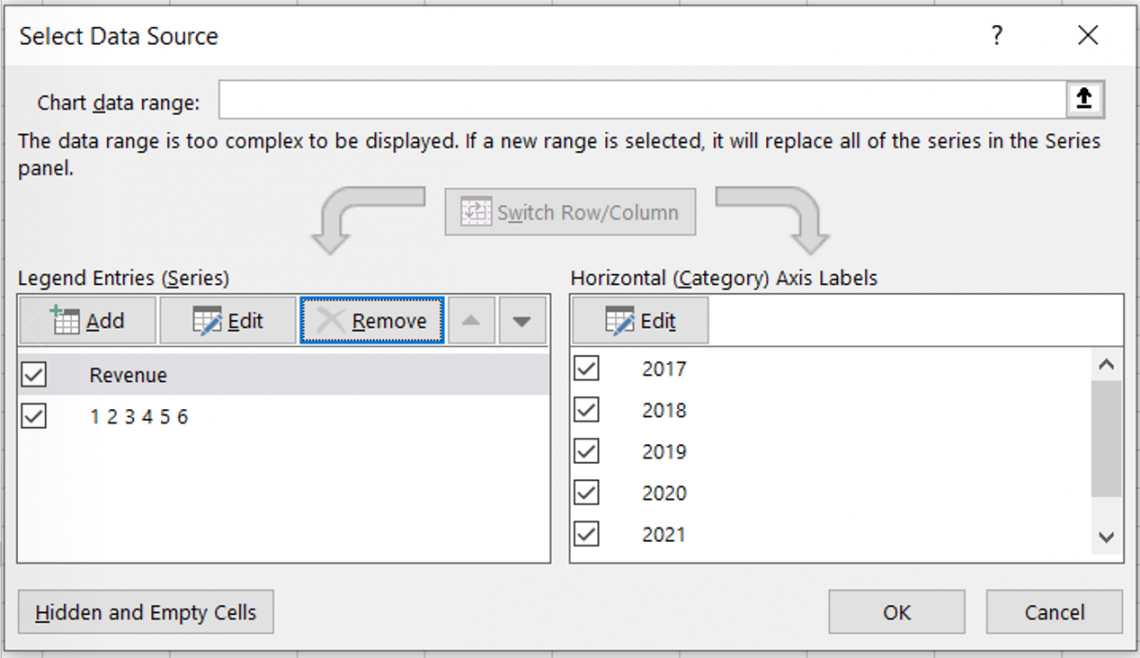
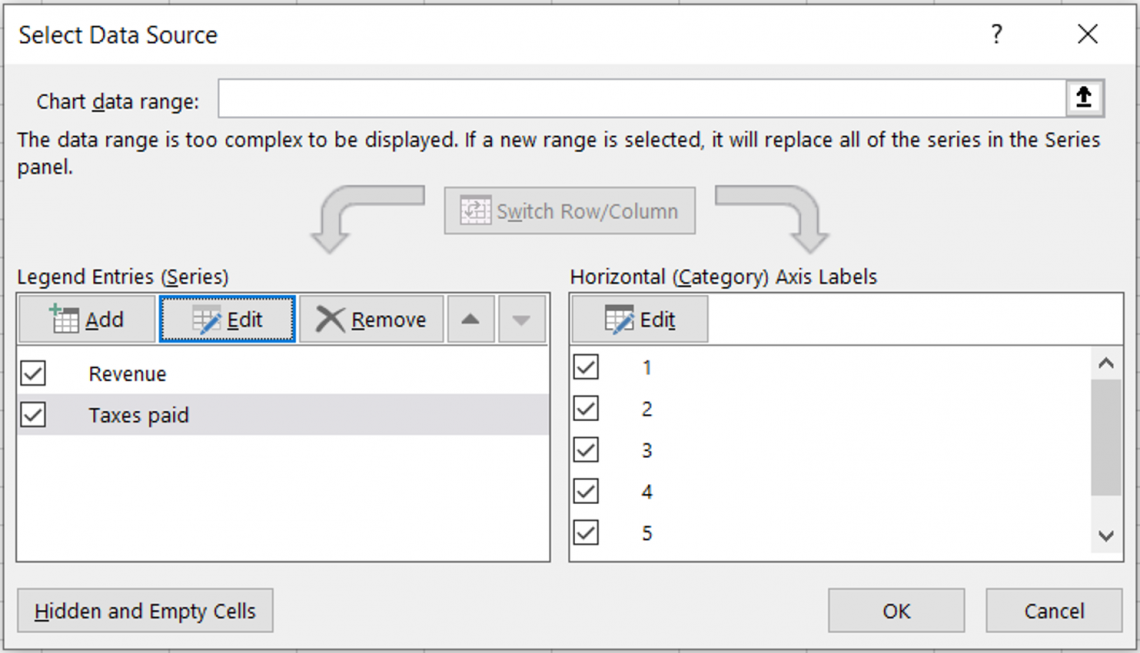
It will open the ‘Select Data Source’ dialog box, where you can manually add data series as per your data analysis requirement.
-
Next, you will remove the check from the second ‘Legend Entries’ and add a new entry by clicking on the ‘Add’ button.
-
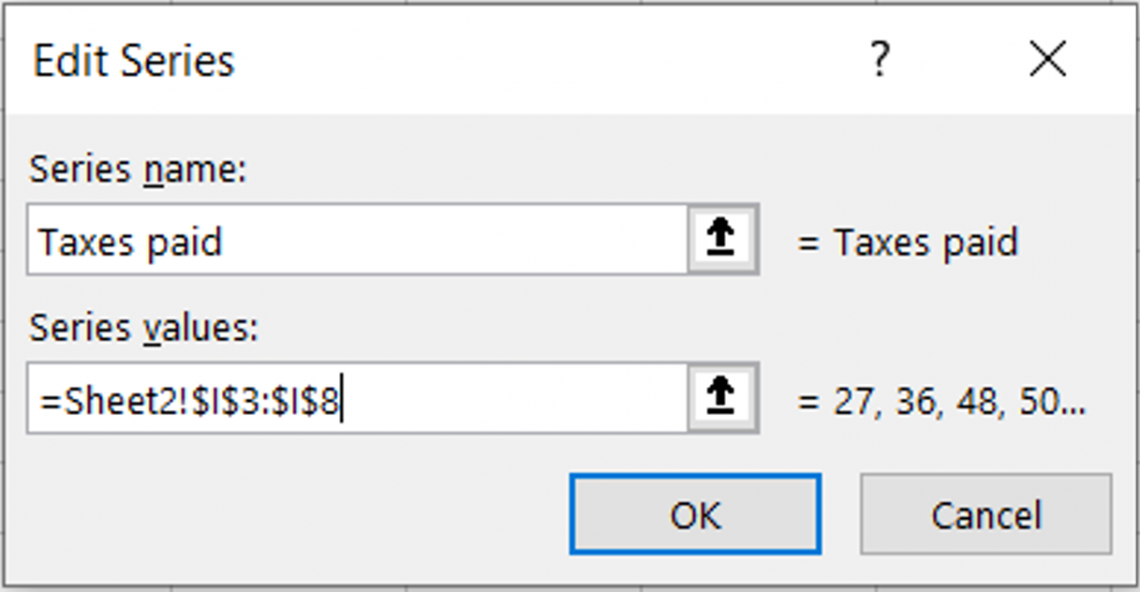
This opens up a dialog box asking you to input the series name and values from the table. After you have selected appropriate values, click OK.
-
Now the data source dialog box will show the series under the ‘Legend Entries.’ Additionally, you can remove the unnecessary data series from the chart. Once done, click on OK.
-
Finally, your chart will look as illustrated below. You can make further changes to the chart by adding secondary vertical and horizontal axes!
Why not use the secondary axis?
Just as every coin has two sides, there are pros and cons when using this in Excel. However, the most crucial problem of including multiple X or Y axes in your chart is that the scale on which they are represented arbitrarily and probably misleads people about the relation between the two data series.
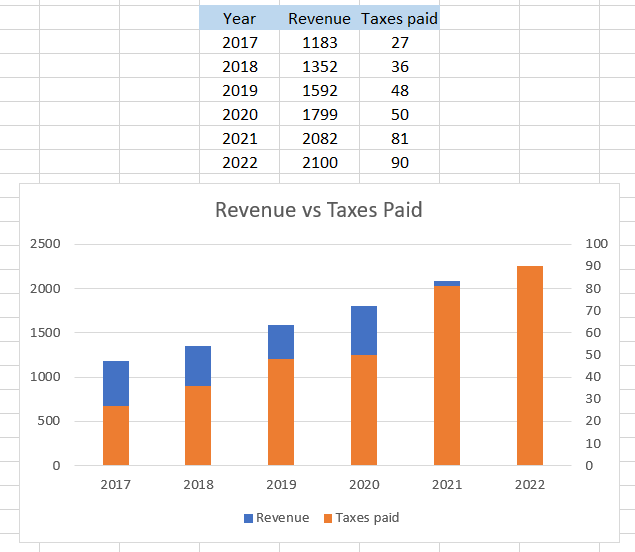
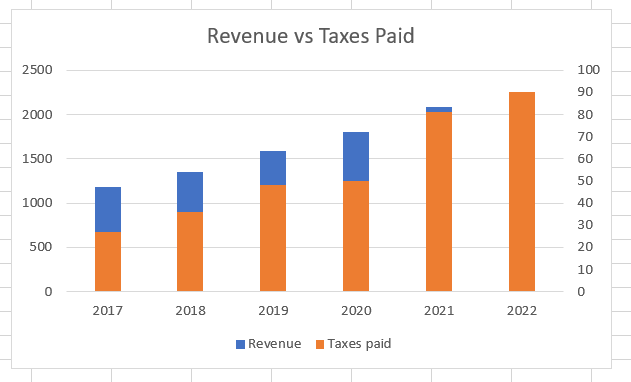
For example, assume the chart we had plotted for Revenue vs. Taxes Paid for company XYZ since 2017.
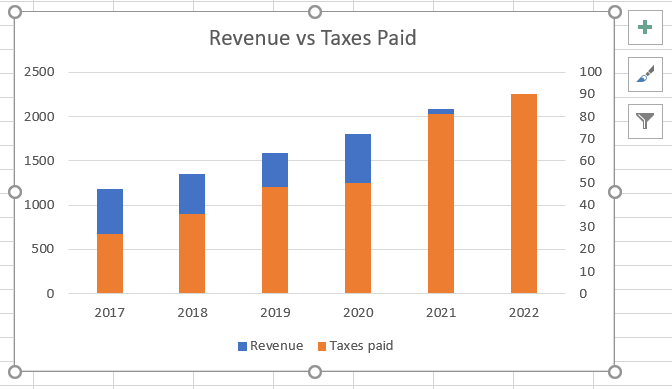
Even though the chart looks normal, the scale for the Y-axis is >=500, while for the secondary Y-axis, it is >=10. There is a humongous difference in the magnitude of both the data series, even if both are represented in US dollars.
For 2022, we see that the orange-colored column has completely covered the ‘Revenue’ column, but is it true that revenue in 2022 is equal to taxes paid in 2022? Absolutely not! Someone unaware of the use of secondary axes in the chart might confuse themselves and make wrong decisions based on chart data visualization techniques.
To conclude, it is an additional axis that you can input on the graph for two different data sources. The easiest method to add it in Excel is with the help of combo charts from ‘Chart Types,’ where you need to tick the check box and press Ok. If you need to remove the axis, all you need to do is press the delete key.

Free Resources
To continue learning and advancing your career, check out these additional helpful WSO resources:


or Want to Sign up with your social account?