Consumer Surplus Formula
The monetary gains a consumer obtains as they can purchase a product at a price lesser than the highest price they are generally willing to pay

What Is Consumer Surplus?
The concept of Consumer Surplus was developed in 1844 by a French civil engineer and economist named Jules Dupuit. Economist Alfred Marshall later popularized it to ascertain the social benefits of public goods.

Consumer Surplus refers to the monetary gains a consumer obtains as they can purchase a product at a price lesser than the highest price they are generally willing to pay.
Alfred Marshall defines it as “Excess of the price that consumer would be willing to pay rather than go without a commodity over that which he pays.”
It is the difference between the consumer’s willingness to pay for a commodity and the actual price paid by the consumer for that commodity. This actual price is also referred to as the equilibrium price.
According to the economic theory of marginal utility, the utility or satisfaction provided by a commodity varies from individual to individual based on their preferences or choices.
The more of a commodity a consumer has, the less they are willing to spend on it due to diminishing marginal utility. Because of this diminishing marginal utility, the demand curve is downward sloping.
This surplus is an excellent way to measure the value of goods and services and an important tool used by governments in the Marshallian System of Welfare Economics to formulate tax policies.
- Consumer surplus is the benefit from buying below what you're willing to pay, crucial in measuring social benefits.
- It's the area under the demand curve above the price line, the largest for higher willingness-to-pay units, shrinking with higher prices.
- Mathematically, it's represented as a triangle area or derived through demand and supply functions, showcasing the positive difference between maximum willingness to pay and market price.
- The rule of one-half governs changes in CS due to shifts in supply, illustrating how increased supply reduces prices, expanding CS to benefit various types of consumers.
Consumer Surplus Graphical representation
It is determined as the area below the demand curve and the area above the price line where the demand curve represents the consumer’s willingness to pay at different price levels. Some important inferences:
-
It is highest at the largest units of a commodity for which the willingness to pay is not below market price, even for the last unit.
-
It increases with a fall in the price of goods and vice versa.
-
It is positive when the amount the consumer is willing to pay is greater than the actual price.
-
It is infinite when the demand curve is inelastic.
-
Lastly, consumer surplus is zero for a perfectly elastic demand curve
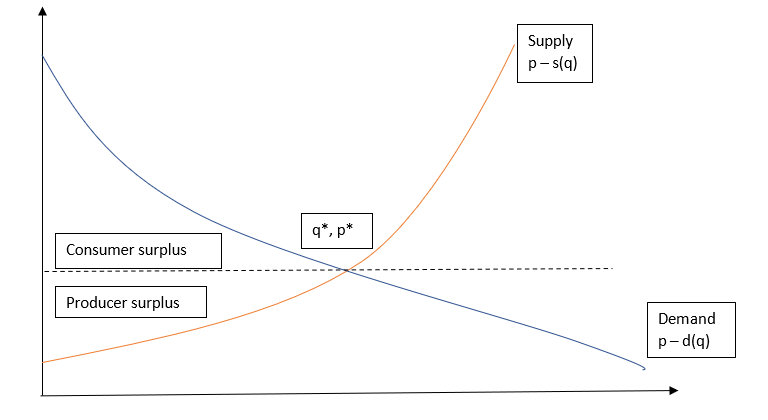
The intersection between demand and supply gives an equilibrium price. This price can also be obtained with the intersection of the marginal utility curve and price line.
The area below the supply level and the equilibrium price is known as producer surplus. The area below the demand level and above the equilibrium price is known as consumer surplus.
Producer and consumer surplus together are a part of economic surplus, also known as total welfare or total social welfare, or Marshallian surplus.
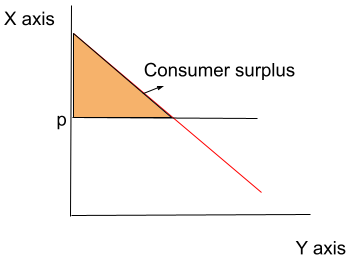
.In the diagram below, the red line depicts a demand curve or a marginal utility curve, and the black horizontal line is known as the price line. The shaded area represents consumer surplus which is the area below the demand curve and above the price line.
Suppose a consumer is willing to pay USD 500 for the first unit of a commodity and USD 100 for the last unit, given there are 50 units of the commodity. If all the units are sold at USD 100 each, then 49 units are sold at a surplus, assuming constant demand.
A mobile phone provides a high level of utility and satisfaction to consumers as they are often willing to pay more than the market price. However, consumer satisfaction will decrease with subsequent purchases.
Consumer Surplus Mathematical representation
If the demand curve is a straight line, then consumer surplus is represented by the area of a triangle, where
Consumer Surplus= 1/2Qmkt (Pmax - Pmkt)
where,
Qmkt - equilibrium quantity
Pmax - maximum reservation price
Pmkt - market price
Given a demand function p = d(q) and supply function p = s(q) and the equilibrium points (p*, q*) consumer surplus is given by:

The above formula is derived in the following manner:


For general demand curves, the surplus is calculated using:

Where D(Pmax) = 0. Integrals run from market price (P Mkt) to maximum reservation price(P max) for a given demand function.
With the rise in equilibrium price and a fall in equilibrium quantity, consumer surplus falls.
Using utility:
Consumer Surplus = Total utility (TU) - (Total units purchased ✕ Marginal utility (MU))
The above equation states that a consumer's surplus is a positive difference between the total utility from a commodity and the total payments made for it. Here marginal utility can be substituted by the price of the commodity.
As the consumer reaches equilibrium when marginal utility is equal to price, he purchases those many units of a commodity at which MU=P. He gets a surplus for all the units except the one at the margin.

Sign Up for our Free Excel Modeling Crash Course
Begin your journey into Excel modeling with our free Excel Modeling Crash Course.
Change in consumer surplus
This is given by the Rule of one-half. Here, a change in consumer surplus is an area of a trapezoid with height equal to a change in price and mid-segment length equal to the average of equilibrium quantities before and after a change in supply.
Δ Consumer Surplus = 1/2(Q1 + Q2)(P0 - P1)
Where Q1 and Q2 are quantities before and after a change in supply and P0 and P1 are priced before and after a change in supply.
Mechanism: When supply expands, the commodity's price falls, and consumer surplus increases. These benefits are distributed among two types of consumers.
-
The consumers whose initial willingness to pay was even higher than the price before the change in supply, and now with a price reduction, they can buy more and enjoy more surplus
-
Those consumers were reluctant to buy at the initial price. Now, as the prices have reduced, they would also buy the commodity and obtain consumer surplus also.
Numerical example 1
Suppose the demand for a commodity is given by
p = d(q) = -0.8q + 150
and the supply for the same commodity is given by
p = s(q) = 5.2q
, where q is the quantity of the commodity and p is the price in USD.
Consumer Surplus is calculated as:
Step 1: Calculate equilibrium quantity
-0.8q + 150 = 5.2q
-0.8q - 5.2q = -150
4.4q = 150
q = 25
Step 2: Calculate the equilibrium price
5.2(25) = 130
Step 3: Calculate consumer surplus
![]()
= 250
Here, the consumer's surplus is USD 250.
Numerical example 2
Marginal utility, price, and consumer surplus schedule
| Units | Marginal utility (in USD) | Price(in USD) | Consumer’s surplus (in USD) |
|---|---|---|---|
| 1 | 10 | 2 | 8 |
| 2 | 8 | 2 | 6 |
| 3 | 6 | 2 | 4 |
| 4 | 4 | 2 | 2 |
| 5 | 2 | 2 | 0 |
| 6 | 0 | 2 | -2 |
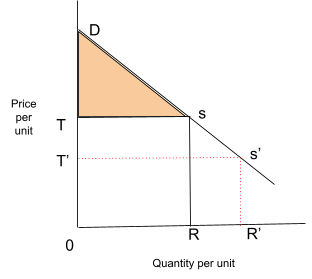
If a consumer buys all the units (OR) at RS price per unit, he gets a total satisfaction of the area DORS, but he spends only the ORST amount of money. Here surplus is DTS. If the price falls to R’S’, he would buy OR’, and the surplus would increase to DT'S'.
The table above depicts the cardinal measurement of utility derived from additional units and the prices consumers are ready to pay.
Concept of Price ceiling and Price flooring
A binding price ceiling is one that is lower than the equilibrium market price. This means that the consumers can purchase a commodity at a price lower than what normally would be available.
For consumers to achieve the surplus requires purchasing the commodity, which in turn requires producers to produce more of that commodity at that price. But this is non-profitable for the producers since the price is lower than the market price.
So any increase in the surplus will be offset by the shortage of supply as consumers won’t be able to buy the quantity they desire. Benefits from the price drop will be outweighed by a decrease in the quantity.
When a price floor is set above the equilibrium price, consumers will have to purchase the commodity at a higher price than what they want resulting in a decrease in demand for the item. Hence, consumer surplus will reduce.
Consumer Surplus Assumptions
The following assumptions were provided by Alfred Marshall while giving Consumer Surplus Theory:
-
The utility is a measurable unit: Under Marshallian economics, the utility can be measured in numbers.
-
No substitutes available: It suggests that substitutes/ replacements for commodities are not considered.
-
Ceteris Paribus: It states that the income, taste, and preferences of a consumer do not change.
-
The marginal utility of money is constant.
-
The Law of diminishing marginal utility prevails.
-
Independent marginal utility: It suggests that the marginal utility of a commodity is unaffected by the marginal utility of any other commodity similar to the commodity being purchased.
Consumer Surplus Limitations
The limitations of the consumer surplus theory are as follows:
-
Difficulties in calculating the precise amount of consumer surplus due to difficulty measuring marginal utilities of different units of commodity consumed by a person.
-
Infinite consumer surplus of necessary goods since marginal utilities of the first few units of necessary goods are infinitely large.
-
Consumer surplus is affected by the availability of substitutes for the commodity being purchased.
-
The utility-scale for luxury goods is very difficult to derive.
-
The concept of marginal utility comes into practice only when the assumption is made that utility can be measured in terms of money.
WATER-DIAMOND PARADOX
The marginal utility per liter of water for a consumer is very low as the actual water supply is very large. On the other hand, the marginal utility of demand is very high because the quantity available is very small.

Everything You Need To Master Valuation Modeling
To Help You Thrive in the Most Prestigious Jobs on Wall Street.


or Want to Sign up with your social account?