Demographics
Demographics is a Greek word where 'demos' means people and 'graphics' means picture
What Are Demographics?
Demographics is a Greek word where ‘demos’ means people and ‘graphics’ means picture. It is a particular characteristic of a large population over a specific time interval. Population economists use demographics while conducting surveys, research, etc.

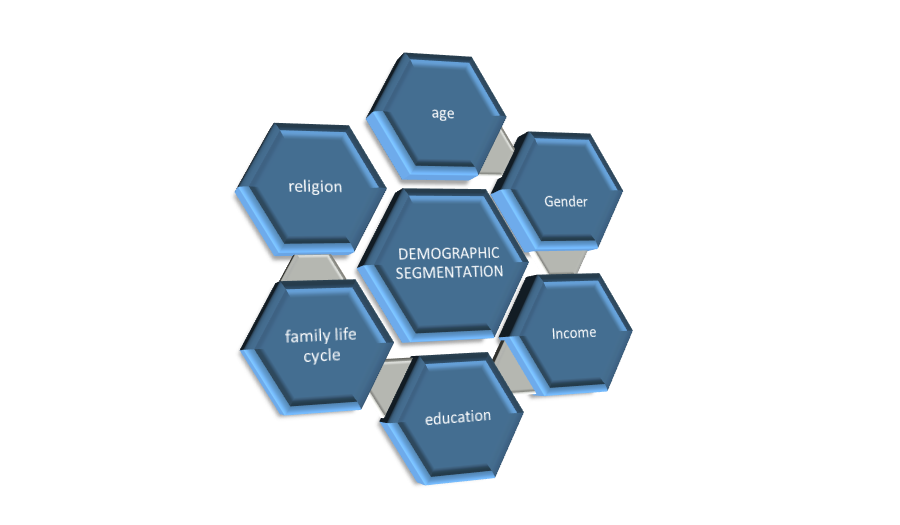
Factors include race, age, gender, religion, ethnicity, income, home ownership, education, sexual orientation, family size, employment, location, marital status, disability status, health, psychiatric diagnosis and preferences, hobbies, and lifestyles.
This segmentation explains how researchers divide a market into smaller groups, accommodate customers accordingly, and develop a detailed market plan. It enables accurate marketing planning with effective results.
Governments, non-governmental organizations use demographics, and corporations to learn more about the characteristics of a population to help with things like economic market research and policy development.
Businesses use demographic analysis as a marketing tool to determine the optimal way to reach customers and evaluate their behavior—for example, the size of the potential market by segmenting the population.
Tracking with the global usage of the internet, predictive algorithms, social media, and big data, modern consumers flood the market with data that is very easy using various apps, third-party data collectors, financial transaction processors, and retailers.

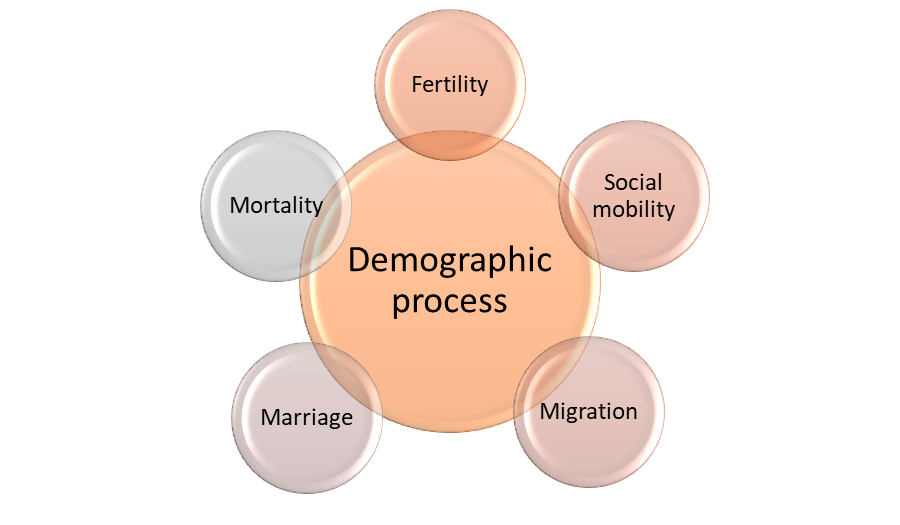
The five demographic processes, or things that change about a group of people, are:
- Fertility: The ability to conceive children.
- Mortality: The state of being subject to death, or the number of deaths in a given area or period.
- Marriage: It's the legal or formally recognized union of two people.
- Migration: The movement of people to a new place or a country to find work or better living conditions.
- Social Mobility: The movement of individuals, families, households, or other categories of people within or between social classes in a society.
Key Takeaways
- Demographics, derived from the Greek words 'demos' (people) and 'graphics' (picture), encompasses various characteristics of a population, including race, age, gender, income, education, and more.
- Demographic segmentation involves dividing a market into smaller groups based on characteristics, allowing for targeted marketing strategies. Also, accurate demographic analysis aids businesses in reaching customers effectively and understanding their behavior, influencing market planning.
- The global usage of the internet, predictive algorithms, social media, and big data has transformed how demographics are tracked, with modern consumers contributing vast amounts of data through various platforms and apps.
- Fertility, mortality, marriage, migration, and social mobility are the five key demographic processes that define changes within a group of people over time.
- Aging populations and declining birth rates can have significant economic implications, affecting factors such as GDP growth, labor markets, monetary policy, and fiscal policies.
Implications of Aging
The implications are:
1. As a propeller of economics
There is a clear relationship between population and economic growth, given by:
The growth rate of GDP = The growth rate of the population + The growth rate of GDP per capita
Where GDP per capita is GDP divided by the population.
Another way to look at this is through the Cobb-Douglas relationship, which states that any change in economic output results from a change in capital stock, labor stock, and the state of technology in an economy.
Labor force participation (LFP) indicates the percentage of people employed or searching for work in a country, excluding those unemployed or not searching for a job. A low level of LFP implies poor economic growth.
Though LFP has declined over time, there is an increase in labor productivity. This increase results from technological advancements that make each worker more productive.
Technology and Hard-working employees help to create sustainable economic growth.
Being key determinants of potential economic growth, an aging population and a decline in the birth rate can result in a reduction in future economic growth.
For example, a fall in the working-age population of Japan has made the cost of maintenance of the elderly population less manageable because of the increasing burden on the labor force and government through social security, medicare, etc.
Apart from this, demographics also affect the composition of growth by framing aggregate consumption, savings, and investment decisions. For example, an increase in longevity implies savings and demand for health care and housing.
2. Labor markets
It influences the supply of labor. As people live longer and the mortality rate declines, the supply of labor increases. An increase in life expectancy indicates that individuals need to work for a more extended period to save for retirement.
Overall, labor force participation shows a downward trend as the population ages. The changing age distribution also affects the long-run natural rate of unemployment, as well as labor force growth and participation.
The timing and magnitude of the effect of the labor markets can not find out with certainty as some possess counterbalancing factors like an invisible change in workers' retirement age, the difference in productivity with age, and government policies.
3. Monetary policy
Changes in demographics affect the transmission mechanism of monetary policy. It enables us to understand the difference between the wealth effect and the income effect.
Older people hold more assets compared to young people. Therefore, to meet their consumption during retirement, they tend to be creditors, spending on the accumulation of assets. On the other hand, young people tend to be borrowers.
The propagation of interest rate change throughout the economy will likely change with a shift from young to old. It's because a smaller share of young individuals enjoys a decrease in the interest rate, whereas older people enjoy the benefits of higher asset prices.
Interest rate changes also affect the equilibrium long-term interest rate in an economy which, in turn, can affect the long-run growth rate of consumption and, subsequently, output.
Older people tend to reduce their risk exposure, shifting towards assets with a fixed return. It increases the risk premia and reduces the return on risk-free assets.
4. Fiscal and other government policies
The government must bring a combination of increased borrowings, taxes, reduced benefits, program restructuring, and policies into the picture to reduce growing healthcare costs, as fiscal sustainability is dependent on it.
Attention to the policies that increase immigration support continuous education, encourage research and development and promote innovations and incentives to people who work longer become a must for a government.
The role of the government is to protect the individuals under it from all kinds of adversities they have to face due to uncertain situations.
Theories of Demographics
Some of the theories are:
1. Demographic transition theory
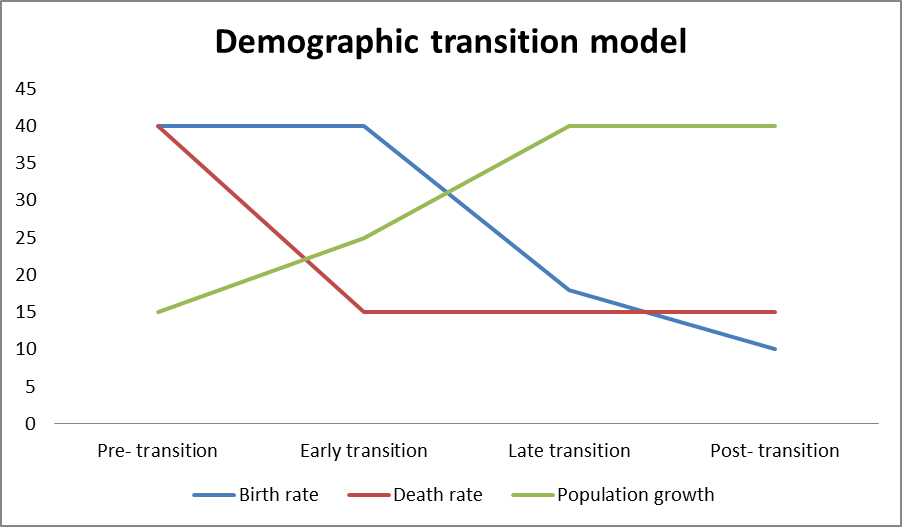
Frank W. Notestein, an American demographer, invented the demographic transition theory. It describes the changing pattern of mortality, fertility, and growth rate with movement in the demographic regime.

The actual graph looks like the freehand drawing below. Above is a clean excel representation of the same.

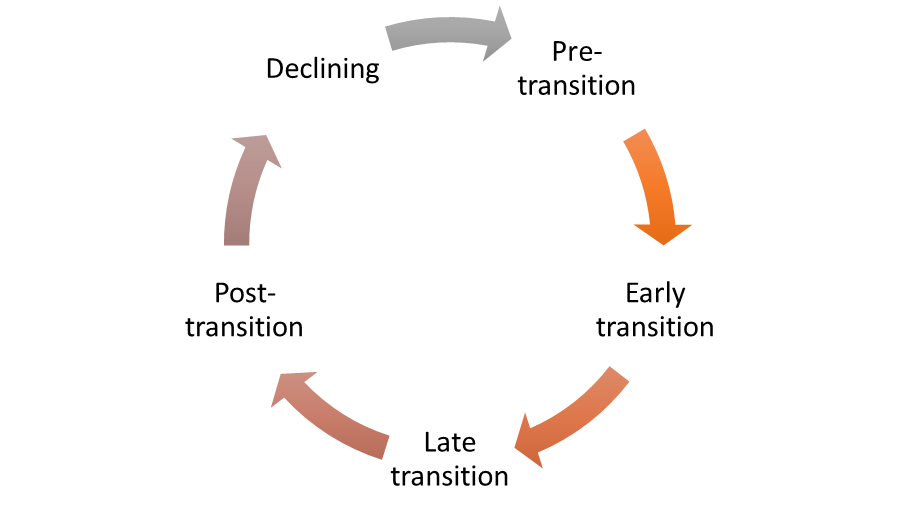
The five stages of the model are:
Stage1: Pre-transition
- High birth rate and high death rate characterized this stage.
- The population growth is slow and fluctuating at this stage.
- The birth rate is high due to a lack of family planning, the need for workers in agriculture, a high infant mortality rate, religious beliefs, and the use of children as economic assets.
- The death rate is high due to higher diseases, famine, war, and competition for food with predators. Combined is a lack of clean water, sanitation, healthcare, and education.
Stage 2: Early transition
- In this stage, the death rate begins to fall, and the birth rate remains high.
- Here, the population overgrows.
- The death rate falls due to improvements in health care, like the introduction of the smallpox vaccine, improvement in hygiene and sanitation, and better food production, storage, and transportation.
- A decrease in infant mortality rate also leads to an increase in average lifespan.

Stage 3: Late Transition
- In this stage, the birth rate declines, leading to decelerating population growth.
- The birth rate falls with increased availability of family planning, decreased infant mortality rate, increased standard of living, and increased mechanization. Thus, it reduces the demand for new workers and the changing status of women in society.
Stage 4: Post-transition
- This stage shows a low birth rate and a low death rate.
- The growth of the population is negligible or declining.
Stage 5: Declining
Some economists point out a fifth stage which has below-replacement fertility levels. It suggests a birth rate lower than the death rate, leading to a declining population.
Different countries are at various stages of the demographic cycle.
Examples: South Asia and Africa are in stage 2; India, China, and Singapore are in stage 3; the United Kingdom, Denmark, Sweden, and Belgium are in stage 4. And Germany and Hungary are in stage 5.
2. Malthusian theory
Thomas Malthus made predictions about the earth's ability to sustain its growing population. He identifies war, famine, and disease as the three factors that control the human population.
He gave a practical viewpoint, suggesting that people will run out of food and starve as we can only produce a limited amount of food. The war over increasingly scarce resources would reduce the population to a manageable level.
3. Zero population growth
Paul Ehrlich, a neo-Malthusian researcher, suggested that the environment plays a crucial role in the population's health. He highlighted rapid environmental collapse due to increasing pollution.
He proposed zero population growth, where the number of individuals entering a population either by birth or immigration equals the number of individuals leaving it due to death or emigration.
4. Cornucopian theory
This theory suggests the idea of humans wiping themselves out is unlikely, pointing to the ingenuity of humans to resolve any social or environmental issues. For example, if humans face food supply issues, agricultural scientists would find a way to grow more.
Demographic Trends
These trends intertwine with social, economic, and political ones to create a dynamic context for the functions of towns, cities, and metropolitan areas. At the global level, these trends are forever changing.
In Europe and Central Asia, there was a decline in the urban population in low and middle-income countries between 1991 and 2011. In addition, the rise in average age is decreasing fertility.
These trends are partly due to the emigration of young people.
The urban population growth rate is declining in Latin American and Caribbean regions, and urbanization is shifting to small and medium cities.
The Middle East and North Africa witness conflict, climate-driven migration, and cross-border movements encouraged by economic opportunity. Aging is not an issue, and the large youth population continues to promote higher growth rates.
Africa, the fastest and youngest growing region, possesses excellent diversity. The expectation is that life expectancy could increase between 2015 and 2050. The small and medium cities will absorb most of the population growth.
It Created proper Conditions in South Asia for a youth bulge due to the increase in life expectancy, fall in fertility rate, and low old-age dependency ratio.
Observed the Women's disproportionate distribution and labor market participation in these regions.
The East Asia and Pacific region is currently observing the most prominent regional population of elderly, along with an enormous diversity of aging levels. Moreover, these diversities with national income are correlated.
Diversity in aging refers to a common belief that aging is beyond biological changes. It is associated with other transitions like retirement, relocation to more appropriate housing, and the deaths of loved ones.
By 2050, the global population will increase to 9 billion. There will be slower population growth, older people, and more urban living.


or Want to Sign up with your social account?