Factor Market
A market with different factors of production land, labor, capital, and businesses that are bought and sold.


What Is a Factor Market?
A factor market is defined as a market with different factors of production land, labor, capital, and businesses that are bought and sold.
Factor markets are the opposite of product markets. Instead of producing goods/services to sell to the public, factor markets consist of goods/services sold to companies to use in their manufacturing process.
An example of a possible factor market would be the timber industry. They provide the factor/resource for companies in the housing industry to construct houses for the public; thus, both markets are intertwined. In the product market, firms are the sellers, and households are the buyers.
In a factor market, households are the sellers, and firms are the buyers. The firms purchase labor from households.
The two aspects that decide the price and quantity of a good produced in the product market are where the demand and supply curves meet. Similarly, in the factor market, the demand and supply curves dictate the number of workers that would be hired and their wages.
- A factor market, also known as a resource market, is where factors of production (inputs used to produce goods and services) are bought and sold. These factors include labor, capital, land, and entrepreneurship.
- Factor markets are vital for economic efficiency, stability, income generation, and driving innovation and growth, thereby influencing overall economic well-being.
- Labor Market deals with the hiring of workers, where employees supply labor and employers demand labor.
- Functions of Factor Markets play a crucial role in price determination, resource allocation, and income distribution, ensuring economic efficiency and stability.
Understanding a Factor Market
A factor market is where inputs like labor and capital are bought and sold to produce goods and services.
A common rule of thumb for a company involved in factor markets is to hire where your marginal revenue per product (MRP) = your marginal revenue cost (MRC/MFC). This is the optimal point of hire because it maximizes the revenue you could get from your hired labor.
The formula to calculate the MRP of your company is
MRP = Change in Total Revenue/ Change in Output
By calculating effectively, you can easily determine how much revenue each new worker adds to your company. You could also multiply the marginal product and price of the resource.
The formula to calculate the MRC/MFC of your company is
MRC/MFC = Change in Total Factor Cost/ Change in Input
By doing this calculation effectively, you can quickly determine how much it costs you for each new worker added to your company.
Another important note is that the MRC can also be referred to as the marginal factor cost (MFC).
If you would like to learn more about MRC and MRP, here is a link to a document that further explains how to calculate the two.
Types of Factor Markets
Within factor markets, there are two different types:
1. Perfectly Competitive
Many firms hire workers, and all the workers have identical skills. The firms are also price takers, meaning they set their wages according to the market.
- An example of a perfectly competitive factor market would be Supermarket Cashiers. They all have identical skills and are employed in a market with many different firms. The firms in this market all offer relatively the same wage.
2. Monopsony
This consists of only one firm hiring workers, and the firms that fall into this category are wage makers. Wage makers mean that they dictate what wage they want to pay their employees.
- An example of a monopsony could be a coal mining company in a coal mining town. Since the coal company is the only employer of labor, they fall under the monopsony category.
- Unlike perfectly competitive firms, monopsonies need to increase their wage for each new worker hired.
In addition, perfectly competitive firms and monopsonies also have different graphs for different characteristics. Look below to understand the distinction between the two varieties further.
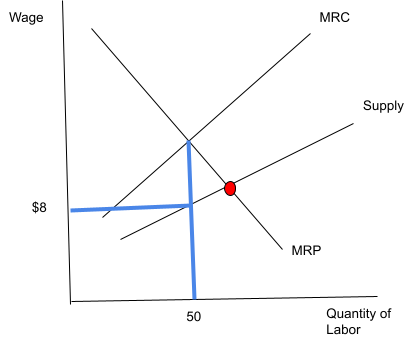
Perfect competition in the factor market
Let's look at the graph below:

As you can observe from the graph, this is a perfectly competitive factor market graph. The market sets the price at which to hire the labor, and if you look over the firm graph, you can see how the firm employs ten workers at that wage. Also, note how they hire where MRC=MRP.
The supply curve on the market graph represents the number of workers willing to work at each wage. Notice how, as the wage increases, the quantity increases. This is because more people would want to work for a higher wage.
The demand curve on the market graph represents the number of workers the firms want to hire at each point. Notice how as the wage drops, firms want to hire more workers. Any business would like to hire more people at lower wages.
The intersection between these two curves is called the equilibrium point. This is where the households and firms decide it is a fair price in exchange for labor, and everyone follows that price.
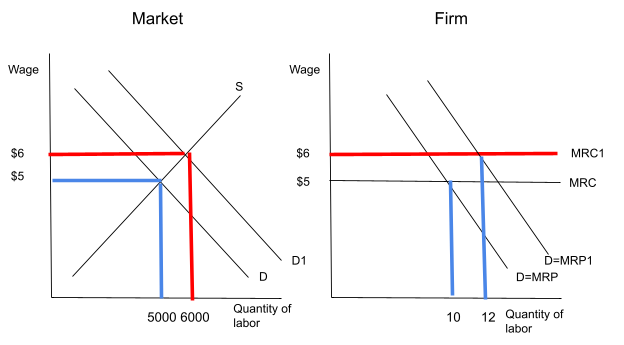
Monoposony in the factor market
Let's understand by taking a look at the graph below:
As you can assume, the following is the graph of a monopsony. Here the MRP=MRC rule still applies. First, you find where they connect; then, you drop down from that point till you hit the supply curve. That point represents the wage the workers will work for.
The MRC is above the supply curve because this firm is a wage maker. Therefore, it must pay more for each worker hired.
Also, the red dot on the monopsony graph marks the competitive equilibrium point on the graph. This is known as the competitive point because it would result in the employment of more workers and the implementation of high wages.
The demand side of the factor market graph
Several methods from which the MRP curve on the perfectly competitive market and monopsony graphs could change.
- Changes in Product Demand: An increase in the product's price increases the MRP. You are now generating more revenue for each product you sell.
- Changes in prices of other resources: The MRP of your product could either increase or decrease depending on substitutes or complements of your product.
- If the price of a substitute increases, the demand for your product increases, increasing the price and MRP along with it and vice versa.
- If the price of a complement increases, the demand for your product falls, causing the price of your product to fall and decreasing your MRP along with it, and vice versa.
- Changes in Productivity: If workers start producing more products, their revenue automatically increases. Since your revenue increased, the MRP increased as a result.
Increase in Product Demand
Suppose the demand for the product increases—the new equilibrium quantity on the product graph increases. Therefore, the factor market demand for labor also increases to produce the unknown quantity.
As stated before, since the product's demand increases, the price also increases in the product market, so the revenue per product increases.
This increase forces the market equilibrium wage to increase, and the number of people interested in the job also increases. Note that the numbers are just there to display the trend and aren't reflective of exact numbers.
Decrease in the Price of a Substitute Resource
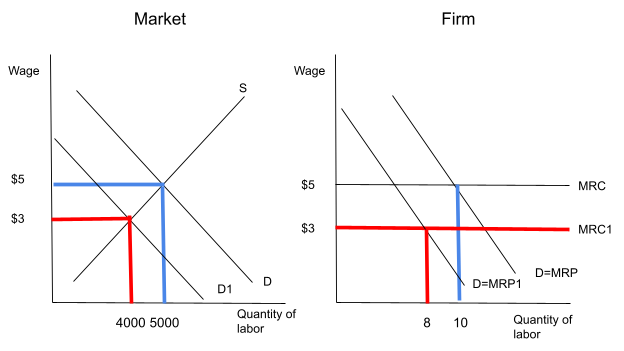
The best way to explain this scenario is to use a real-life example. Let’s say, for instance, wood and brick are substitute goods. As a result, companies in the brick industry experience technological advances, causing brick prices to decrease.
Now the public starts to buy more brick to build their houses, and there is a noticeable decrease in demand for wood. This is because people notice the lower price of brick, which causes the price of wood to decrease and the quantity to fall.
You are a part of the wood market, and as you can tell from the graph, the demand for wood has fallen in your market. This causes your MRC to go down following the equilibrium point, and your MRP also decreases due to a decrease in the price of wood.
Decrease in the Price of a Complement Resource

The best way to explain this scenario is to use a real-life example. For example, paint and brick are complementary goods—companies in the brick industry experience technological advances, causing brick prices to decrease.
Now the public starts to buy more brick to build their houses, and there is a noticeable decrease in demand for wood. This causes the price of wood to decrease and the quantity to decrease.
Since brick and paint are complementary goods, people also start to buy more paint. This increases the demand in the paint market, and the MRP and MRC curves of the firm will also increase, reflecting the change in prices and equilibrium point of the market graph.
Increase in Productivity

The best way to explain this scenario is to use a real-life example. For this example, let’s use the sugar industry.
Recently, the sugar industry went through a technological advance. They built new machinery that doubled their sugar production rate. This machinery was widespread throughout the industry and not just in one particular firm.
Since they can now produce more sugar than previously, they also need the proper amount of labor to man the machinery as it produces the sugar. This causes an increase in the demand for labor in the market.
The supply side of the factor market graph
Now let us go over shifts of the supply curve:
- A Number of Qualified Workers: If there is an increase in the number of workers in a centurion market/industry, this causes a rightward shift in the supply curve, indicating an increase in supply.
- Government Licensing: The government can increase or decrease the requirements for pursuing a particular trade, causing shifts in the supply curve of the market graph accordingly.
- Values: People may be more inclined to pursue certain jobs only depending on values and personal beliefs.
Increase in the Number of Qualified Workers
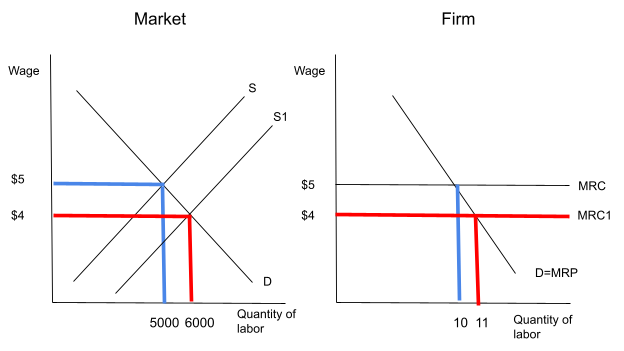
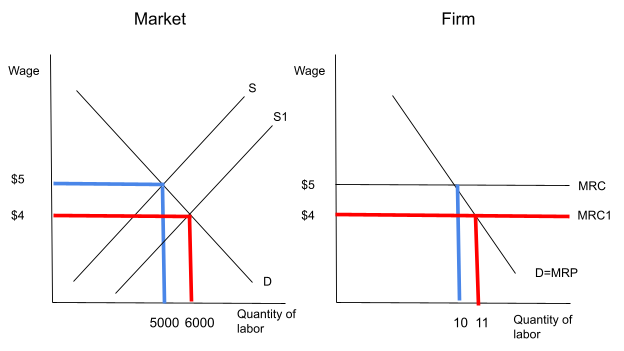
There is a sudden increase in interest in being a cashier at fast-food chains by the job market—the supply of people willing to work increases, causing a rightward shift in the supply curve.
This increase lowers the price of hiring workers for firms, and it also shifts the MRC curve down accordingly, allowing firms to hire more at a lower wage.
Decrease in Government Regulation
The government conducts multiple studies that all conclude that being a doctor shouldn’t require multiple years of higher education. This the government to reduce the requirements of becoming a doctor.
Lowering the requirements causes more people to be interested in pursuing a career as a doctor since there are fewer requirements to be one. This increases the supply of workers, causing the MRC to shift down.
Decrease in Supply Caused by Personal Values
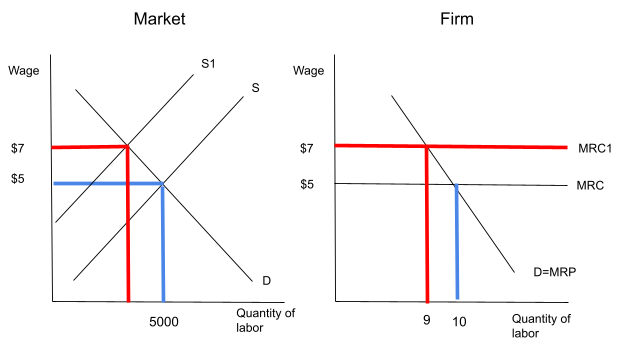
In this scenario, many people decide it is against their moral values to be a cashier at a fast-food chain. This causes the supply of willing workers to decrease and therefore shoots the wage up to $7.
Another vital distinction to notice is the increase in the MRC curve in the firm graph.
All methods we just went over caused shifts in the market naturally, except for government regulation on the supply curve; however, there are ways in which the government could artificially manipulate the curves on the graphs to shift.
One of those ways would be the implementation of a minimum wage. The government forces the market to adopt a wage point usually above the equilibrium point by creating a minimum wage.
Since the minimum wage pushes the wage paid to workers above the equilibrium point, firms hire fewer workers to keep costs stable. They are no longer interested in hiring the same number of workers due to the high costs of bringing them in.
Enactment of a Minimum Wage in a Perfectly Competitive Market
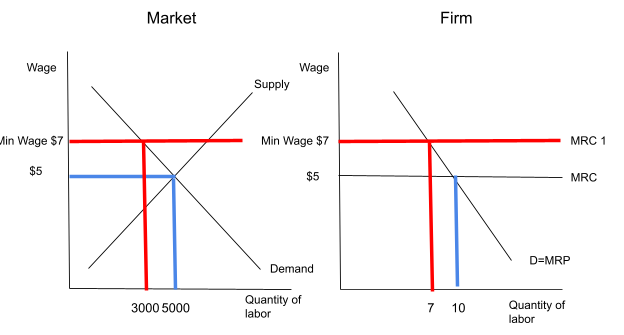
As you can see in the image. The government's enactment of a minimum wage forces the market to employ fewer workers at a high wage. In the firm’s graph, you can see how they also reflect the change in the market by employing fewer people as well.
As stated before, this enactment causes the supply of workers willing to work at that price to be greater than the demand for workers at that wage. Therefore, this difference causes a surplus since the supply offered is greater than the demand wanted.
This surplus can also be noted down as unemployment. Although minimum wage boosts workers' pay, it sometimes causes unemployment within the industry to increase. Therefore, it is essential to consider all factors before enacting government policies.

Researched and authored by Siddharth Devabhaktuni | LinkedIn
Free Resources
To continue learning and advancing your career, check out these additional helpful WSO resources:


or Want to Sign up with your social account?