Hoover Index
An economic metric that measures the economic effect of a particular business on a local business using an input-output model.


What is the Hoover Index?
The Hoover Index is an economic metric that measures the economic effect of a particular business on a local business using an input-output model.
Income inequality has risen significantly in the modern world, with the gap between the wealthy and poor ascending in numerous countries worldwide.
While there are many measures of income inequality, the Hoover Index is one of the most widely used income inequality metrics. Economist Edgar Malone Hoover developed it in 1936 and measures how unequally income is distributed within a population.
This creates a value between 0 and 1 by adding the squared income shares of every person or group in a population and dividing the outcome by the total number of individuals or groups.
- A value of 0 represents total equality, and 1 represents perfect inequality.
- Values ranging from 0 to 1 indicate varying degrees of income inequality.
It has turned into a basic instrument for policymakers, researchers, and businesses looking to all the more likely comprehend and resolve issues of income inequality.
Its simplicity and scale independence make it easy to apply across different countries and periods. Furthermore, its sensitivity to changes in income distribution enables policymakers to track the success of programs targeted at lowering income inequality.
Notwithstanding its popularity, it has various limits and assumptions that should be considered while assessing its outcomes.
For example, it only considers income and assumes that income is equally distributed within each group. These limitations show the need to combine them with other measures of income disparity.
This article will provide an in-depth discussion of the HI, its formula, properties, interpretation, and applications. We will explore its advantages and disadvantages and how it might guide policy decisions to increase economic equality.
- The Hoover Index, also known as the Robin Hood Index, is a measure of income inequality. It indicates the proportion of total community income that would need to be redistributed to achieve perfect equality.
- The Hoover Index is calculated as the proportion of total income that must be transferred from the richer half of the population to the poorer half to achieve an equal distribution. It ranges from 0 (perfect equality) to 1 (perfect inequality).
- A Hoover Index of 0 indicates that income distribution is perfectly equal, meaning everyone has the same income.
- A Hoover Index of 1 suggests that all income is concentrated in the hands of a single individual or entity, representing maximum inequality.
Hoover Index Formula
It is a measure of income inequality determined by multiplying the squared income shares of every individual or group in a population by the total population size.

Its formula can be expressed mathematically as follows:
H = [1/ (2N)] * ∑[(y_i/ Y) - 1/ n]2
Where:
- H = the Hoover Index
- N = the total number of people or groups in the population
- y_i = the income of the person or group i
- Y = the total income of the population
- n = the number of people or groups in the population with the same income as person or group i.
To compute it, we must first identify the income shares of each individual or group in the population. The income share is essentially the extent of the total income that every person or group procures.
We can calculate the income share of a person or group I by dividing their income by the total income of the population:
(y_i/Y)
Next, we square each income share and sum them up for all people or groups in the population:
∑[(y_i/ Y)^2]
Finally, we divide the result by twice the total number of people or groups in the population:
[1/ (2N)] * ∑[(y_i/ Y)^2]
The factor of 1/2 is included to ensure that the HI ranges between 0 and 1.
The second component of the calculation, [(y_i/Y) - 1/n], accounts for the fact that people or organizations with the same income share may have different numbers of members.
For example, two groups may each receive 10% of total revenue. However, one group may have 100 members while the others may have only ten. Factor 1/n adjusts for this by weighting the income share by the inverse of the group size.
Note
The HI formula considers the income share and the number of people or groups with that income share to provide a comprehensive measure of income inequality within a population.
Properties of Hoover Index
It possesses several properties that make it an effective tool for measuring inequality in income. Understanding these properties is essential for interpreting their results and using them effectively.
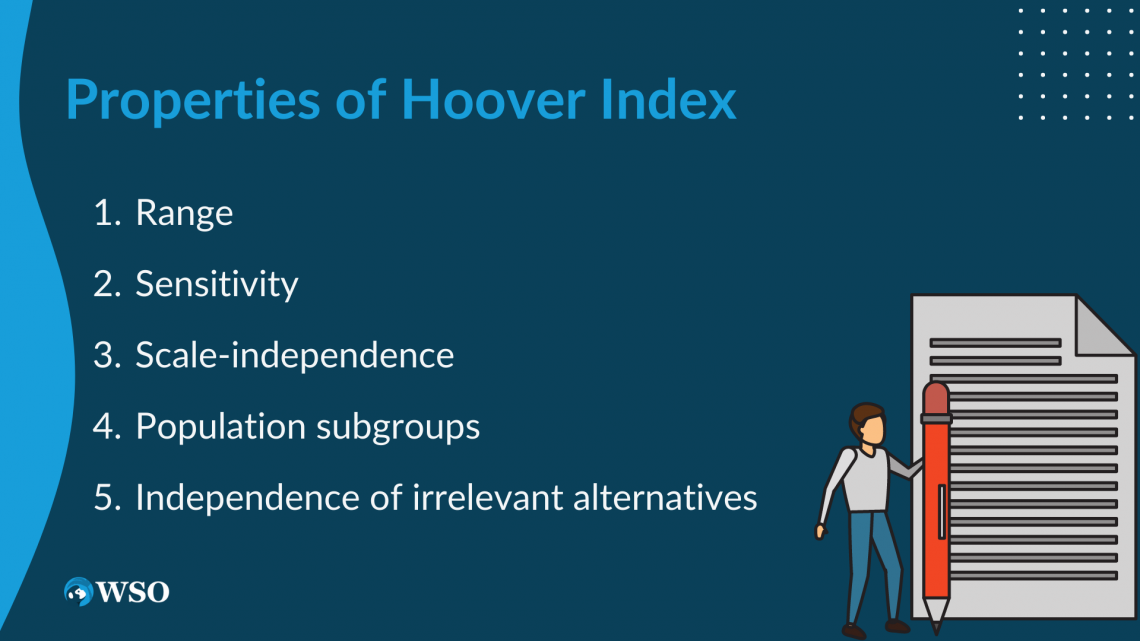
Here is a portion of its critical properties:
- Range: It goes from 0 to 1, with 0 indicating perfect income equality and 1 indicating perfect income inequality. This means it is a standardized measure that can be compared across different populations or periods.
- Sensitivity: It is sensitive to changes in the distribution of income. For example, as income becomes more concentrated in a few individuals or groups, it increases, indicating greater income inequality.
- Conversely, the HI decreases as income becomes more evenly distributed, indicating greater income equality. Because of its sensitivity, it is a useful instrument for measuring the effectiveness of programs targeted at reducing income disparity.
- Scale-independence: It is scale-independent, which implies that it tends to be applied to populations of any size without requiring adjustments. This makes the HI a useful tool for comparing income inequality across countries or regions with varying population sizes.
- Population subgroups: It tends to be determined for various subgroups inside a population, like gender, race, or occupation. This permits policymakers and researchers to all the more likely comprehend the factors adding to income inequality and develop designated policies to address them.
- Independence of irrelevant alternatives: It satisfies the independence of irrelevant alternative property. This implies that it stays unaltered when the income of one individual or group changes as long as the income distribution of the others or groups continues as before.
Note
The independence of irrelevant alternative property ensures that it is a robust and reliable measure of income inequality.
In general, it is an amazing asset for estimating income inequality that has a few significant properties that make it an important device for policymakers, researchers, and businesses.
Its range, sensitivity, scale independence, ability to measure subgroups and independence of irrelevant alternatives make it a versatile and useful measure for understanding and addressing issues of income inequality.
Interpretation of Hoover Index
It can be interpreted on various levels depending on what the researchers need to find.
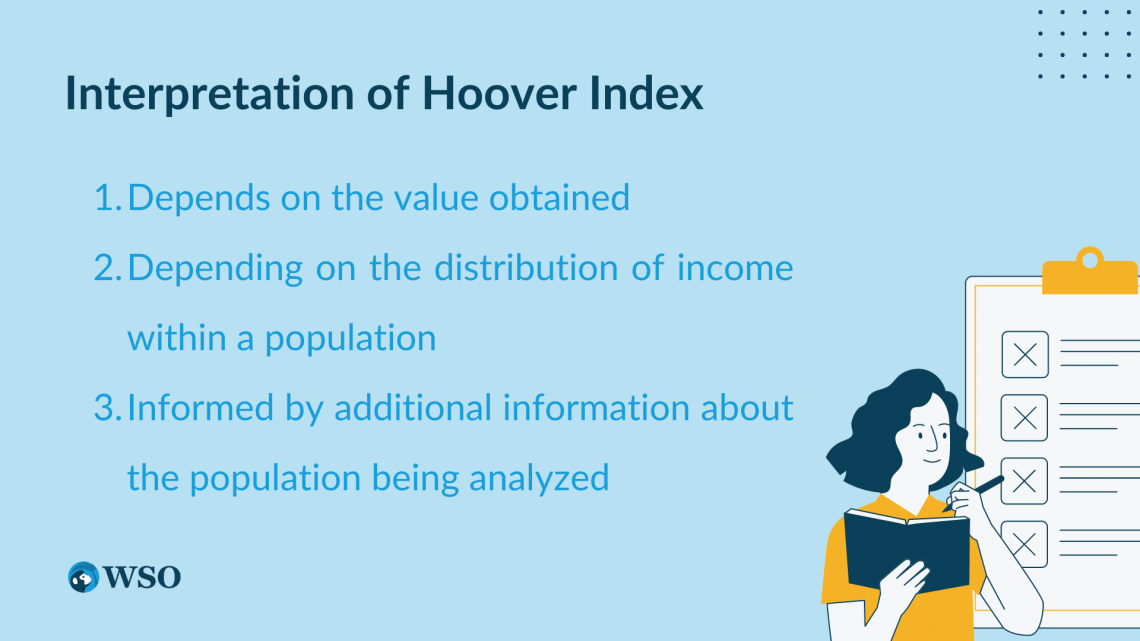
Depends on the Value Obtained
Its interpretation depends on the value obtained.
A value of 0 shows perfect income equality, while 1 demonstrates perfect income inequality. Between these two extremes, the interpretation of the Hoover Index depends on the specific value obtained and the context in which it is being used.
A value of 0.2, for instance, might be viewed as nearly low and demonstrative of the comparable income distribution. Although a value of 0.8 might be considered high and normal for extremely uneven income distribution.
Nonetheless, what comprises a "low" or "high" value relies upon the particular population being broken down and the historical context in which it exists.
Depending on the Distribution of Income within a Population
Its interpretation can also depend on the distribution of income within a population.
For instance, a population with a high Hoover Index, however, a relatively even income distribution might be less unsettling than a population with a low Hoover Index yet a highly uneven income distribution.
Note
When interpreting the results, it is important to consider the Hoover Index value and the underlying income distribution.
Informed by Additional Information About the Population being Analyzed
Additional information about the population being analyzed can also inform its interpretation.
For example, if it is calculated for different subgroups within a population, such as gender or race, differences in the Hoover Index values can provide insights into the drivers of income inequality and inform policy decisions.
Its interpretation requires careful consideration of the analyzed population, underlying income distribution, and additional contextual information.
While a high Hoover Index value may suggest a need for policies aimed at reducing income inequality, the specific policies that are most effective will depend on the underlying drivers of inequality within that population.
Application of Hoover Index
It has many applications in different fields, including economics, sociology, and public policy. Here are some examples of its applications:
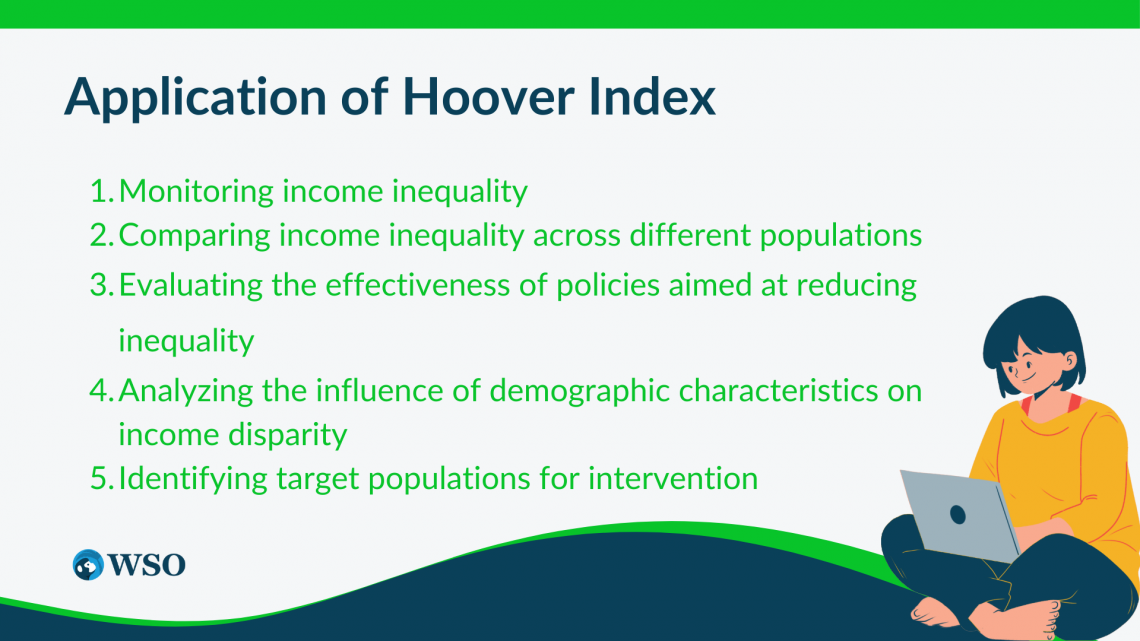
- Monitoring income inequality: Checking changes in income inequality after some time, both inside a particular population and across various populations, can be utilized. In addition, this information can be utilized to illuminate strategy choices aimed at reducing inequality.
- Comparing income inequality across different populations: It tends to be utilized to consider income inequality across various countries, regions, or subpopulations. This information can be utilized to distinguish areas of especially high inequality and foster policies to address these disparities.
- Evaluating the effectiveness of policies aimed at reducing inequality.: It can be used to survey the effectiveness of policies to reduce income inequality, for instance, tax policies, welfare tasks, or education drives.
- By monitoring changes in the Hoover Index after implementing these policies, policymakers can assess their impact and adjust as needed.
- Analyzing the influence of demographic characteristics on income disparity: It might be utilized well to segregate the effect of demographic elements on income inequality, like gender, race, or education level.
- This data can be utilized to foster policies that reduce disparities and advance more prominent equality.
- Identifying target populations for intervention: It can be utilized to recognize target populations for intervention, for example, low-income households or certain demographic groups that are especially impacted by income inequality.
- This data can be utilized to foster policies and projects that are explicitly custom-fitted to these populations. Overall, It is a powerful tool with a wide range of applications.
Note
Its ability to measure income inequality across various populations and after some time, makes it a priceless instrument for policymakers and researchers trying to comprehend and resolve issues of income inequality.
Limitations of the Hoover Index
While it is a valuable instrument for estimating income inequality, it has a few limitations that should be considered. Here is a portion of its limitations:

1. Limited focus on income inequality
It focuses just on income inequality and doesn't consider different factors that add to overall inequality, like wealth, education, or healthcare access. Consequently, it should not be utilized as the sole measure of overall inequality.
2. Sensitivity to population size
It can be sensitive to the size of the population being analyzed. For example, when applied to smaller populations, such as neighborhoods or small towns, it may not accurately capture income inequality, as small changes in income levels can significantly affect the index value.
3. Ignores income distribution
It doesn't consider the particular dissemination of income inside a population and, on second thought, treats all income levels as equal.
Note
Two populations with the same Hoover Index value could have different income distributions.
4. Ignores the role of government policies
It doesn't consider the effect of government policies on income inequality, for example, taxes or welfare programs. This means that changes in the Hoover Index over time may not necessarily reflect the impact of these policies.
5. Limited applicability to non-monetary measures
It is principally centered around income inequality and is less pertinent to non-monetary proportions of inequality, like admittance to education or healthcare.
6. Not sensitive to inequality at the extremes
It may not be sensitive to excessive income inequality, for example, when a small gathering of people holds a disproportionate measure of wealth.
While it is a valuable device for estimating income inequality, it should be utilized related to different measures and contemplations, and its limitations should be considered when deciphering its outcomes.
Hoover Index FAQs

It is a measure of income inequality that ranges from 0 to 1, with higher values showing more prominent inequality.
It is determined by adding the absolute differences between the cumulative proportion of income and the cumulative proportion of the population and dividing this aggregate by 2 afterward.
One of its potential gains is that it considers both the distribution of income and the distribution of population, giving a more nuanced proportion of income inequality than various measures that emphasize income distribution exclusively.
Furthermore, it is relatively easy to work out and decipher, making it accessible to many clients.
Indeed, it very well may be utilized to think about income inequality across various countries or regions, turned out that revenue and population data are accessible for every location.
In any case, it is vital to remember that it might be impacted by contrasts in population size and income levels, and watchfulness ought to be practiced while making cross-country or cross-provincial correlations.
The utilization of it has added to how we might interpret income inequality by giving a basic and powerful method for estimating and screening changes in income inequality over the long run.
By featuring areas of specific concern and distinguishing trends in income inequality, it has assisted with illuminating policies and interventions pointed toward lessening inequality and advancing more significant economic opportunity and social justice.
Furthermore, the utilization of the Hoover Index has assisted with bringing issues to light of the impacts of income inequality on society, remembering its belongings for well-being, education, and social portability.
The Gini coefficient, the Atkinson index, and the Palma ratio are other indicators of income inequality.
The Gini coefficient, which runs from 0 to 1, measures how much the income distribution veers off from perfect equality. Higher values indicate greater inequality.
The Atkinson index runs from 0 to infinity and evaluates inequality while considering society's readiness to tolerate inequality. Higher values indicate greater inequality.
The Palma ratio is the ratio of the top 10%'s total income offer to the bottom 40%'s total income share. It gives a proportion of income concentration at the top and bottom of the income distribution.
Multiple measures can provide a more comprehensive understanding of income inequality and its various dimensions.


Free Resources
To continue learning and advancing your career, check out these additional helpful WSO resources:


or Want to Sign up with your social account?