Input-Output Analysis
A macroeconomics analytical approach that observes the interdependencies between different sectors and industries in a given economy


What Is an Input-Output Analysis?
Input-output analysis (I-O) is a macroeconomics analytical approach that observes the interdependencies between different sectors and industries in a given economy. This type of macroeconomic research breaks into each sector and industry in terms of how they affect the economy.
This approach is frequently used to estimate the consequences of positive and negative economic shocks and to analyze the ripple effects across an economy.
It depicts how the outputs of one sector are used as inputs in another. The I-O analysis approach was established by Wassily Leontief, a Soviet-American economist who won the Nobel Prize in Economics in 1973.
This approach of macroeconomic analysis analyzes the interdependencies between various sectors of an economy by treating each sector's or industry's product as a commodity and a component of production.
- Input-output analysis (I-O) examines how sectors and industries in an economy are interconnected.
- It helps estimate the effects of economic shocks and analyzes ripple effects across the economy.
- I-O tables describe the supply chain of economic sectors and showcase interdependencies.
- Wassily Leontief pioneered this approach, treating each sector's product as a commodity.
- I-O analysis is used in national accounting, research, and policy-making to understand sector impacts.
Origins of Input Output Analysis
Wassily Leontief (1906–1999) is credited with inventing this style of analysis, for which he was awarded the Nobel Prize in Economics.

Léon Walras' work Elements of Pure Economics on general equilibrium theory was a predecessor and generalization of Leontief's key notion. Francois Quesnay had produced a cruder version of this approach called Tableau économique.
Alexander Bogdanov is credited with creating the concept in a report submitted to the All Russia Conference on the Scientific Organization of Labor and Production Processes in January 1921.
This method was also created by L. N. Kritsman and T. F. Remington, who claimed that their work established a link between Quesnay's Tableau économique and Vladimir Groman and Vladimir Bazarov's future contributions to Gosplan's material balance planning method.
The classical economists Karl Marx and Jean Charles Léonard de Sismondi impacted Wassily Leontief's work on the input-output model. Karl Marx's economics described the economy early as a collection of tables with two interconnected divisions.
Leontief was the first to portray a national (or regional) economy using a matrix.
This model displays inter-industry linkages within an economy, demonstrating how the product from one industrial sector can become an input to another.
Column elements in the inter-industry matrix normally reflect inputs to an industrial sector, whereas row entries often indicate outputs from that sector.
As a client of products from other sectors and a provider of inputs, this format demonstrates how reliant each sector is on the other. Sectors may also be internally reliant on a fraction of output shown by the matrix's diagonal entries.
The input-output matrix's columns indicate the monetary value of each sector's inputs, while the rows represent the value of each sector's outputs.
Types of Impacts in Input-Output Analysis
There are "whirlpools and cross currents" of items flowing across industries. The demand-side of the final goods is made up of big inter-industry flows of intermediate products. In contrast, the supply-side comprises massive inter-industry flows of intermediate products.
In essence, the I-O analysis states, "for the whole economy to be in equilibrium, the money value of aggregate output must match the sum of the money values of inter-industry inputs and outputs."
Coal, for example, is an input for the steel business and steel is an input for the coal industry, even though both industries produce outputs. Producing intermediate products (inputs) for use in producing final goods accounts for a significant portion of economic activity (outputs).
I-O models estimate three forms of influence:
- Direct (Primary) effects: The effects of a change in ultimate demand on the consumption of inputs are directly related. A dam, for example, needs steel, concrete, a crew, and construction gear. As a result, it has a direct effect on these inputs.
- Indirect (Secondary) effects: The consequences of providers of closely related inputs increasing their workforce to satisfy growing demand.
- Induced (Tertiary) effects: Accounts for the increase in personal consumption of products and services caused by suppliers' employees.
When a specific input level change is made, these phrases allude to the primary, secondary, and tertiary effects that ripple throughout the economy. Economists can estimate the change in output caused by a change in inputs in one or more specific industries using I-O models.
The overall impact of an event on an economy is the sum of the three types of impacts plus the initial demand shift. Many researchers agree that leakage through savings and spending beyond the local economy reduces the impact of the initial demand change.
It indicates that induced effects are often less severe than indirect effects, which are, in turn, less severe than direct effects. Multipliers on the initial demand change are used to quantify this declining impact. The multipliers are smaller the more leakages there are.
The Static Input-Output Model
The whole economy is split into two sectors:
- Inter-industry sectors
- Final-demand sectors
Both of which can be subdivided further.
Any inter-industry sector's entire production may be used as inputs by other inter-industry sectors, by itself, and final demand sectors. Prices, customer demand, and factor supply are all presented. There are no foreign economies or production diseconomies.
Some of the assumptions are:
- No two goods are created at the same time. Instead, each industry creates a single, uniform product.
- Each producing sector meets the requirements of a linear homogeneous production function, i.e., each sector's output is subject to consistent returns to scale.
- The input combinations are used in predetermined amounts.
The proportions of the inputs and outputs stay unchanged. It indicates that there is no technical advancement and no replacement between various materials. For manufacturing, there are set input coefficients.
Because the model is inherently linear, it lends itself to the quick and flexible calculation of the consequences of demand changes.
Additional columns may be added to the table to undertake environmentally expanded I-O analysis, and I-O models for multiple areas can be connected to explore the impacts of inter-regional trade.
In many industrialized nations, the input-output model's framework has been included in national accounting, and as a result, it can be used to determine crucial measurements like national GDP.
Input-output economics has been used to research regional economies inside a country and design national and regional economies. The economic repercussions of events and governmental investments or programs are measured using I-O analysis.
It is also used to find economically connected industrial clusters, as well as "important" or "target" industries (industries that are most likely to enhance the internal coherence of a specified economy).
By tying industrial output to satellite reports that detail energy use and wastewater generation, I-O analysts have broadened the scope of the approach's applicability.


Input-Output Tables
Input-output tables are used in I-O analysis to describe the supply chain of various economic sectors.
The table has rows and columns for data input that may be used to assess the interdependencies of different sectors and industries in an economy.
In the table, the inputs utilized in the commodity production in the industry and the amount of output produced by the industry are displayed.
An example of an I-O table for a two-sector economy is shown below:
| Sectors | Inputs to Agriculture | Inputs to Manufacturing | Final household demand | Total outputs |
|---|---|---|---|---|
| From Agriculture | 100 | 360 | 140 | 600 |
| From Manufacturing | 80 | 60 | 200 | 340 |
- The agriculture sector generates 600 units of output in total, with the bulk – 360 units – flowing into the manufacturing industry as inputs for its production, as seen in the first row.
- The agriculture sector uses the remaining 100 units as fodder and seeds, and the other 140 units are given directly to households as a final demand.
- The outputs of the manufacturing sector are shown in the second row. Eighty units of output flow to the agriculture sector as inputs or factors of production, such as reaping machines.
- Out of a total of 260 units, 60 units are returned to the industrial sector to aid in the continuation of production activities. Households absorb the remaining 200 units immediately.
While neoclassical economists and policy advisors in the West do not usually use I-O analysis, it has been used in the Marxist economic study of coordinated economies that rely on a central planner.
Input-Output Analysis Table
The mathematics of I-O economics is simple, but the data needs are large since each branch of economic activity's expenditures and income must be represented. As a result, not all nations can collect all the necessary data, and hence the quality of the data varies.
Because the input-output accounts' data collection and preparation procedure is labor and computer-demanding, these tables are frequently published after the data is collected, typically 5 to 7 years later.
Example:
- For clarity, consider a four-sector economy with three industry sectors (X1, X2, and X3) and one final demand sector are taken.
- Horizontal explanation: These three industries' products are used as intermediate products (inputs) and ultimate consumption by the government or household sector.
- Vertical explanation: Total inputs (from all sectors) used by each sector to produce its goods.
| Input requirement of producing sectors | ||||
|---|---|---|---|---|
| The total output of insectors | X1 | X2 | X3 | Final Demand |
| X1 | X11 | X12 | X13 | F1 |
| X2 | X21 | X22 | X23 | F2 |
| X3 | X31 | X32 | X33 | F3 |
| Primary input or labor | L1 | L2 | L3 | |
The rows which are consumption centers can be written as
- X1 = X11+X12+X13+F1
- X2 = X21+X22+X23+F2
- X3 = X31+X32+X33+F3
- L = L1+L2+L3
So,
Xi = ΣXij+ ΣFi
and
L= ΣLi
Where all i's and j's vary from 1 to 3.
The columns that are production functions can be written as
- X1= X11+X21+X31+L1
- X2= X12+X22+X32+L2
- X3= X13+X23+X33+L3
Technological coefficient matrix in I-O Analysis
Let us take an example to understand it better:
| Input requirement of producing sectors | ||||
|---|---|---|---|---|
| The total output of sectors | X1 | X2 | X3 | Final Demand |
| X1 | a11X1 | a12X2 | a13X3 | F1 |
| X2 | a21X1 | a22X2 | a23X3 | F2 |
| X3 | a31X1 | a32X2 | a33X3 | F3 |
| Primary input or labor | L1 | L2 | L3 | |
From the assumption of fixed input requirements, the input used for the ith commodity for a fixed amount to produce jth commodity can be denoted by
aij = Xij/Xj
- X1 = a11X1+a12X2+a13X3+F1
- X2 = a21X1+a22X2+a23X3+F1
- X3 = a31X1+a32X2+a33X3+F1
- L = l1X1+ l2X2+ l3X3
So,
Xi= ΣaijXj+ Fj for i=1,2 and 3
and
L= ΣliXi

- X = AX + F, and
- L = ΣliXi
Therefore,
X - AX = F
[I - A]X = F
X = [I - A]-1 + F
This way, we can get the value of X1, X2, and X3.
Example of Input-Output Analysis
Let us take an example:
| Purchasing Sectors (in Millions USD) | Total Output/ Revenue | |||
|---|---|---|---|---|
| Sectors | Inputs to Agriculture | Inputs to Industries | Final Demand | |
| Agriculture | 30 | 120 | 80 | 230 |
| Industries | 80 | 230 | 130 | 440 |
| Value-added (Labor) | 130 | 80 | 0 | 210 |
| Total Input/ Cost | 230 | 440 | 210 | 880 |
According to the first row total, agricultural output is estimated at $230 million per year. However, as stated in the third column of the first row, $80 million of this total goes to final consumption (demand), i.e., households and government.
Agriculture's remaining product is used as inputs, with 30 percent going to itself and 120 percent going to industry. Similarly, the second row depicts the distribution of the industrial sector's overall production, valued at $440 million annually.
Columns 1, 2, and 3 demonstrate that 80 units of manufactured products are used as agricultural inputs, 230 units are used in industry, and 130 units are used for ultimate consumption in the household sector.
The input or cost structure of the agriculture industry is described in the first column. Agricultural production of $230 million is created with $30 worth of agricultural items, $80 worth of manufactured goods, and $130 worth of labor services.
In other words, the agriculture industry spends $230 million to generate $230 million in income. The second column, likewise, explains the industrial sector's input structure (i.e., 120 + 230 + 80 = 440).
As a result, "a column delivers one point on the relevant industry's production function." The 'final demand' column displays the money available for personal consumption and government spending.
The third row, which corresponds to this column, has been left blank. This indicates that the household sector is purely a spending (consumption) sector that does not sell anything.
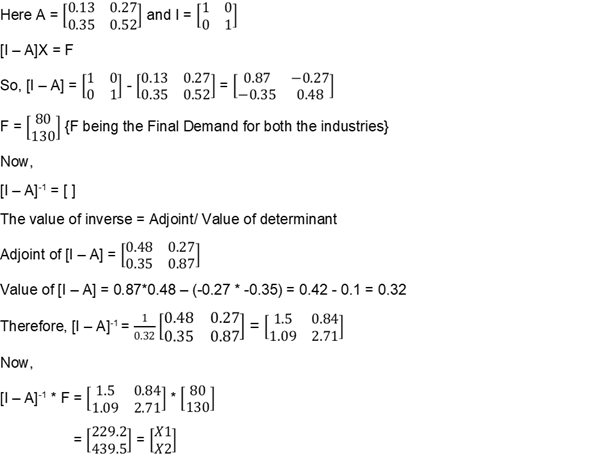
With the Technological coefficient Matrix:
| Purchasing Sectors | ||
|---|---|---|
| Sectors | Inputs to Agriculture | Inputs to Industry |
| Agriculture | 30/120 = 0.13 | 120/440 = 0.27 |
| Industry | 80/230 = 0.353 | 230/440 = 0.52/td> |


or Want to Sign up with your social account?