Supply
The total quantity of goods and services in an economy available for consumers' consumption.


What Is Supply?
Supply is one of the fundamental concepts of economics, is the total quantity of goods and services in an economy available for consumers' consumption.
It could be given for a product or service at one special price or a range of prices for one product or service and can also be displayed through the help of a graph as well. It is related closely to the demand for goods and services at a special price.
All other factors being constant, the supply of the product will rise if the price elevates as all the firms seek to maximize profits by increasing stock and the prices.
The Law of supply states that consumers' demand for more goods and services gives the supplier or producer of those goods a green light to produce more to increase the supply, eventually leading to higher prices.
This pattern may vary highly across different products and price ranges. Many factors can affect the supply of a commodity. We will discuss them later.
As mentioned earlier, it is closely related to demand as well. Thus, to comprehend its concept clearly, we also must have a firm understanding of demand. These two components are interrelated. Both have an equal amount of significance in the economy.
It can also be comprehended visually with the help of curves. It helps us gain an overall picture of the supply of a commodity at a certain quantity available and price. We will certainly look into the depth of the graphs and curves to understand its concept.
Throughout this article, we will look into the factors affecting stock in-depth and various concepts concerning its concept, along with the history and formula to calculate the supply of a commodity.
Let us look into it in more detail and understand it in depth.
- Supply refers to the total amount of a specific good or service that is available to consumers in a market. It represents the quantity that producers are willing and able to sell at various price levels over a specific period.
- The law of supply states that all else being equal, an increase in the price of a good or service will result in an increase in the quantity supplied.
- The supply curve is a graphical representation of the relationship between the price of a good and the quantity supplied.
- If supply is elastic, producers can increase output without a significant rise in cost. If supply is inelastic, producers find it difficult to change production levels in response to price changes.
Understanding Supply
The concept can be mathematically complex, constituting many formulas and accounting for its factors. It could be anything with an established demand in the marketplace, but in theory, we assume that it mostly refers to goods, services, and labor.

Price
Price is the essential factor of numerous factors affecting a good's stock. When the price of a good increases, so does the supply of that good. Thus, the price and supply of a commodity share an inverse relationship in that sense.
In other words, there is an inverse relationship between the price the consumers are willing to pay for a product and the price that the manufacturers want to sell.
Technology
Other factors can also influence it. The production of any product can be affected by any technological advancements that recently took place, leading to an increase in the quality of the products produced.
NOTE
The government regulations of the government of the land where the company is operating can also have an impact on the supply.
For example, suppose a manufacturer requires raw materials to be extracted from the earth. In that case, rules, regulations, and laws must be heeded to maintain the right balance. Thus, this can influence the production of the commodity.
Cost Of Production
Cost of production is another impacting factor. Suppose the cost of production increases for the companies; their supply of products will eventually shrink to the lowest levels if they keep on manufacturing them.
For example, an increase in the cost of raw materials, increase in the wages rate of labor, tax increase, transportation costs, etc., will increase the costs of production for the company, due to which it will eventually have to scale down the production of the commodity, leading to decrease in it.
However, all these costs are reversed, and the supply will increase as the marginal costs (additional costs) of production will drop with each manufactured product.
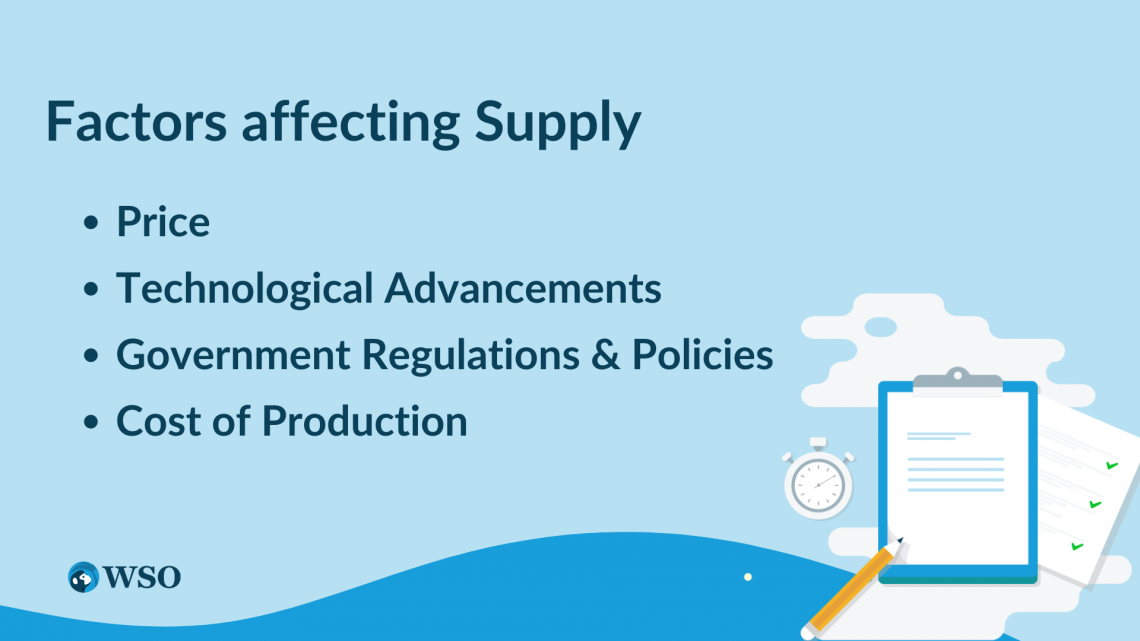
Government Policies
Another factor could be the changes in government policies. The government plays a crucial role in protecting and regulating different industries. Thus, laws and regulations for companies could differ depending on the industry they are a part of.
Government policies can adversely impact the supply factor of the companies. For example, the lower the tax, the higher the stock of goods and services available for consumers.
However, if the excise duty is added to the products, the supply will fall due to less demand caused by increased prices by excise duty.
Electronic gadgets like computers, mobile phones, and televisions are good examples of products that are available in quite a large amount and are affordable today, thanks to technological advancements that have happened over the years.
Other than the commodity's price, all these factors cause a shift in the curve in either the left or right direction, depending on whether the supply increased or decreased by its impact.
History of Supply and Its Calculation
The history goes together with the history of demand. However, supply-side economics, also known as trickle-down economics, was first used by the US economist Arthur Laffer and then implemented by President Ronald Reagan in the 1980s. Their theory had supporters as well as detractors like any other theory.

The supply curve using graphical methods was first used in the 1800s and was further propagated by Alfred Marshall in 1890 through his textbook, "Principles of Economics."
As for its numerical calculation, it can be represented by an algebraic formula as well.
Following is the formula to derive the supply of any commodity at any given price, given that other factors are constant:
Q = x + yP
In the formula given above,
- Q represents the units supplied of that commodity,
- x is the quantity of units,
- P is the price of the commodity and
- y is the level of activity in the market.
If the price is higher, more suppliers would be willing to produce the commodity as it will be more profitable for the firm to produce items with a higher price.
Just like demand, it also depends on factors other than price, as discussed above. These factors, all combined, result in the supply function.
It is a functional relationship between the quantity supplied for a particular commodity and the factors that influence the supply.
The supply function can be represented as follows:
Sx = f(Px, Po, Pf, St, T, G)
Here,
- Sx is the supply of the given commodity,
- Px is the price of a given commodity,
- Po is the price of other goods,
- Pf is the price of the factors of production,
- St is the current state of technology,
- T is the taxation policy followed by the government and
- G are the goals of the firm.
However, this is the individual supply function that accounts for the factors affecting the supply of one commodity.
Coming to the curves, an individual curve can be graphically represented below.
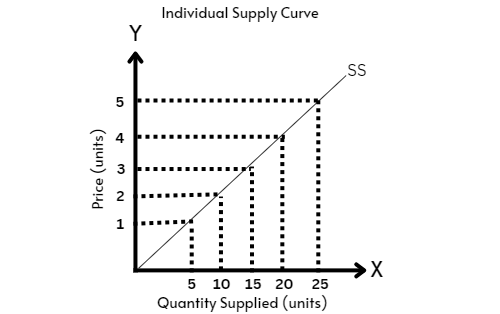
Supply curve 'SS' is obtained by plotting the points in the table below. It shows that at each possible price, there is a quantity that the firm is willing to sell. Thus, by joining all the points, we get the curve sloping upwards.
| Price (in $) | Quantity of supplied goods x (in units) |
|---|---|
| 1 | 5 |
| 2 | 10 |
| 3 | 15 |
| 4 | 20 |
| 5 | 25 |
Now, why does the slope only propagate in an upward direction? The reason is no-frills. Since there is a positive relationship between the price and the quantity supplied of the commodity, the slope SS is in an upward direction.
Coming to its exceptions, no matter how well-written a theory is, there are always exceptions to them.
Similarly, its theory needs a few exceptions to be kept in mind.
- Industries where a monopoly exists forego the laws of supply. That single seller is the one who decides on the price of the goods as well as their supply to the market.
- Some goods have a short shelf life. These goods are called perishable goods. Companies are sometimes even ready to sell such goods at a lower price if they do not sell at a specific price.
- Rare items are often available at premium prices and, thus, fail to follow simple laws of demand and supply.
- When a company or an entity is liquidated, there may be circumstances when they have to sell the assets at a price less than the scrap value estimated simply to convert goods into cash immediately.
Supply Related terms
Let us look into the various terms concerning supply.
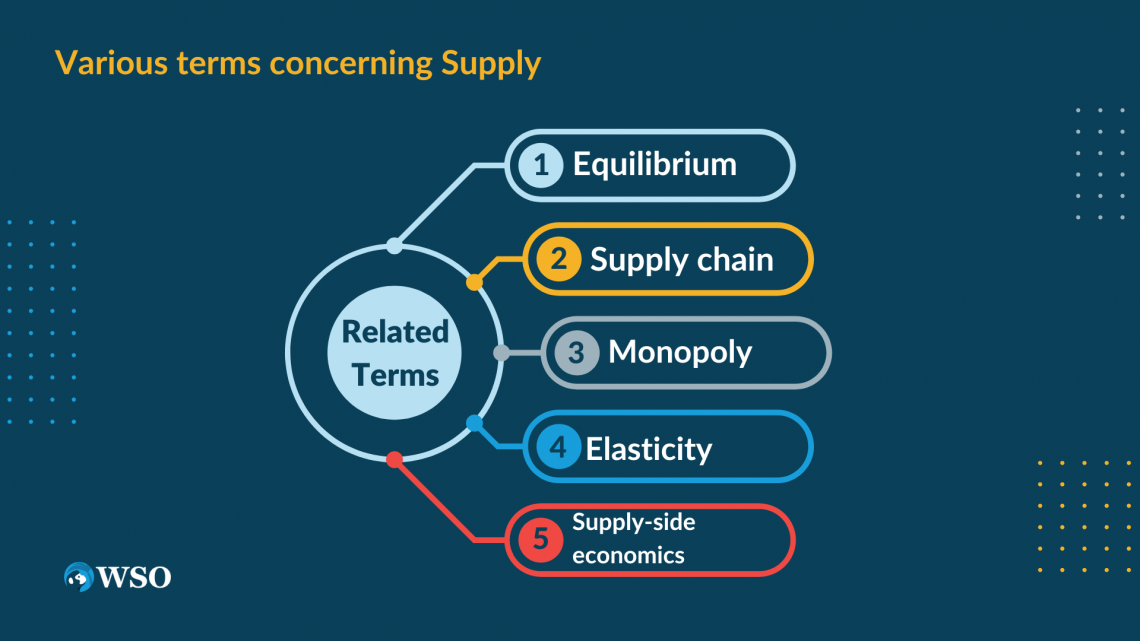
Equilibrium
In economics, the term equilibrium is used for a point where the supply and demand of a commodity are balanced. This is depicted by an upward-sloping supply curve and a downward-sloping demand curve intersecting at the equilibrium point.
The price at which these curves intersect is the price of equilibrium. It is achieved when the consumers agree to buy the product at the price the supplier is willing to offer. It also means there is neither a shortage nor an excess of it.
Supply Chain
It could be described as the chain or the network that connects the company/ manufacturer to the supplier, the one who directly deals with the consumers.
This segment of the whole process of supply focuses on the distribution of the goods and services produced.
It consists of activities like the transportation of finished goods, their storage at various warehouses located near and around markets, and then finally, distribution of them to the consumers.
Monopoly
A monopoly is a market structure wherein there are many buyers of that single product but only one seller. This means that the seller holds the purchasing power now, and there is no negotiating left on the consumer's side.

The monopolist can adjust the price according to them to maximize the business's profits. They can also control the stock availability of the product. However, Governments set a limit to the powers that the monopolist can exercise.
Elasticity
Elasticity, in economics, refers to the percentage change in quantity supplied over the percentage change in the price of that commodity. A price elasticity of supply greater than 1 depicts that it is highly elastic concerning any changes in the price. If it is less than 1, it is inelastic.
Similarly, if it results in an elasticity of 1 unit, then the elasticity is unitary.
The elasticity of supply = % change in quantity supplied/ % change in price
Supply-side Economics
It is a theory that states that increasing the production of goods and services in the economy will boost economic growth. It is also known as trickle-down economics.
It emphasizes rendering businesses with better business opportunities and freedom to produce goods. The three principles that form this theory are
- tax policy,
- regulatory policy, and
- monetary policy.
It is an essential concept as it assures that sufficient goods are produced so that the demand for those goods is maintained at an adequate level. If the demand for these goods is more than what is being produced, the price of that commodity will increase.
This creates a supply curve that helps restrict the amount of goods and/or services produced at a particular price level, as explained in the above sections.
It also supports the business by ensuring that a particular number of the goods produced are made available to consumers at different price levels to meet the requirements of different market segments.

Free Resources
To continue learning and advancing your career, check out these additional helpful WSO resources:


or Want to Sign up with your social account?