Debt Equity Ratio
A financial metric that compares a company's total debt to its shareholders' equity, representing the extent to which debt is used to finance assets
What Is Debt-to-Equity (D/E) Ratio?
The Debt-to-Equity ratio (D/E ratio) is a financial metric that compares a company's total debt to its shareholders' equity, representing the extent to which debt is used to finance assets.
Bankers and other investors use the ratio with profitability and cash flow measures to make lending decisions. Similarly, economists and professionals utilize it to gauge a company's financial health and lending risk.
The D/E ratio belongs to the category of leverage ratios, which collectively evaluate a company's capacity to fulfill its financial commitments.
Key Takeaways
- The Debt-to-Equity (D/E) ratio measures a company's leverage by comparing its total debt to shareholders' equity, providing insight into how much debt the company uses to finance its operations compared to equity.
- The ratio can be calculated using different formulas, such as Debt/Equity, Long-term Debt/Equity, or Total Liabilities/Equity, each offering a nuanced perspective on debt management and financial risk.
- Investors and analysts utilize the D/E ratio to assess a company's financial health and risk profile, with a high ratio suggesting higher financial risk due to heavy debt reliance, while a low ratio indicates a more conservative financial structure.
- There is no universal standard for a "good" D/E ratio, as it varies across industries and company circumstances, with factors like industry norms, investor preferences, and financial management strategies influencing interpretation.
D/E Ratio Formula
Generally, the debt-to-equity ratio is calculated as total debt divided by shareholders' equity. But, more specifically, the classification of debt may vary depending on the interpretation.
Thus, the debt-to-equity ratio may be calculated using one of the following formulas:
- Debt/ Equity: focuses on the company's borrowed funds rather than the total obligations
- Long-term Debt/ Equity: focuses specifically on long-term debt, which is often perceived as riskier compared to short-term debt
- Total Liabilities/ Equity: considers the total amount of the company's obligations and is the easiest to calculate as the necessary information is available on the company's balance sheet, and no adjustments are necessary
We can write it in two ways:
1. Short formula
Debt to Equity Ratio = Total Debt/Shareholders' Equity
2. Long formula
Debt to Equity Ratio = (Short Term Debt + Long Term Debt + Fixed Payment Obligations)/ Shareholders’ Equity
Example of D/E Ratio
Let's calculate the Debt-to-Equity Ratio of the leading sports brand in the world, NIKE Inc. The company's reporting period ends on May 31. The latest available annual financial statements are for the period ending May 31, 2022.
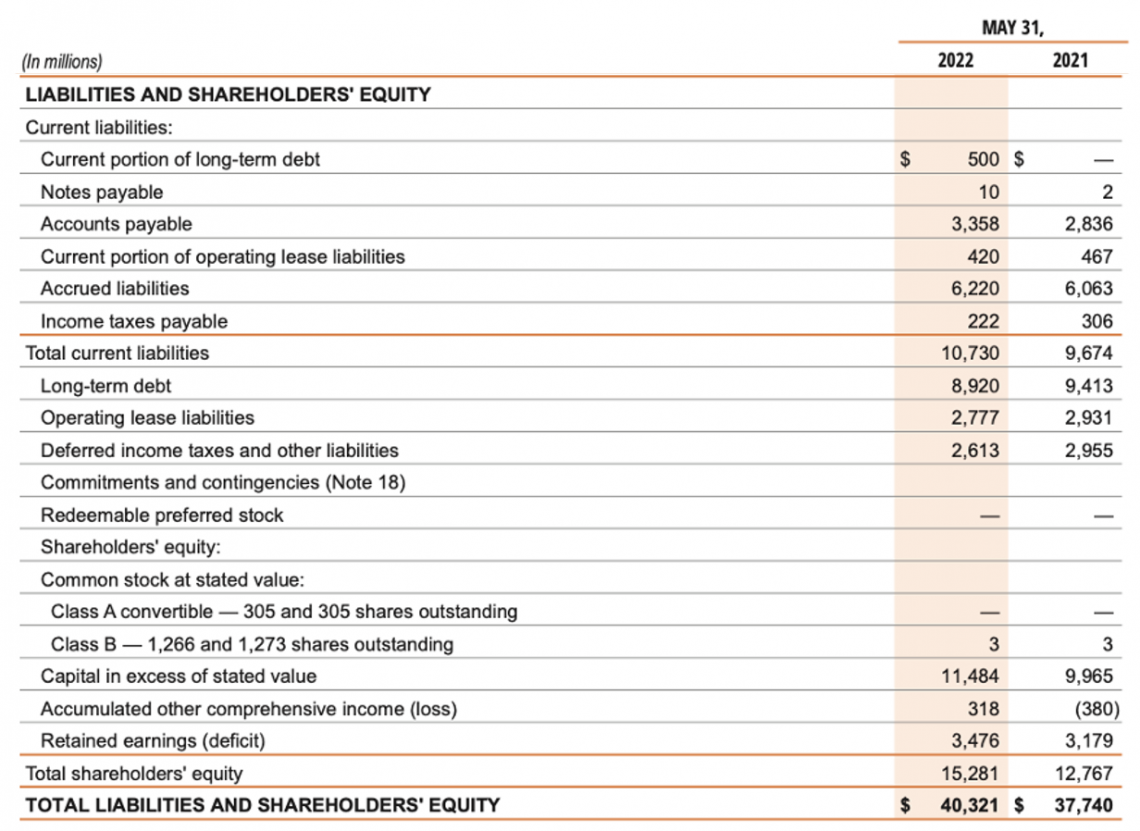
First, you must collect all the necessary data from the company's financial statements. The extract from the company's balance sheet:

Also, depending on the method you use for calculation, you might need to go through the notes to the financial statements and look for information that can help you perform the calculation.
In its financial statements, NIKE Inc. discloses the definition of debt that will help you adjust the total liabilities amount. The amount of total debt includes:
- Current portion of long-term debt
- Notes Payable
- Current portion of operating lease liabilities
- Long-term debt
- Operating lease liabilities
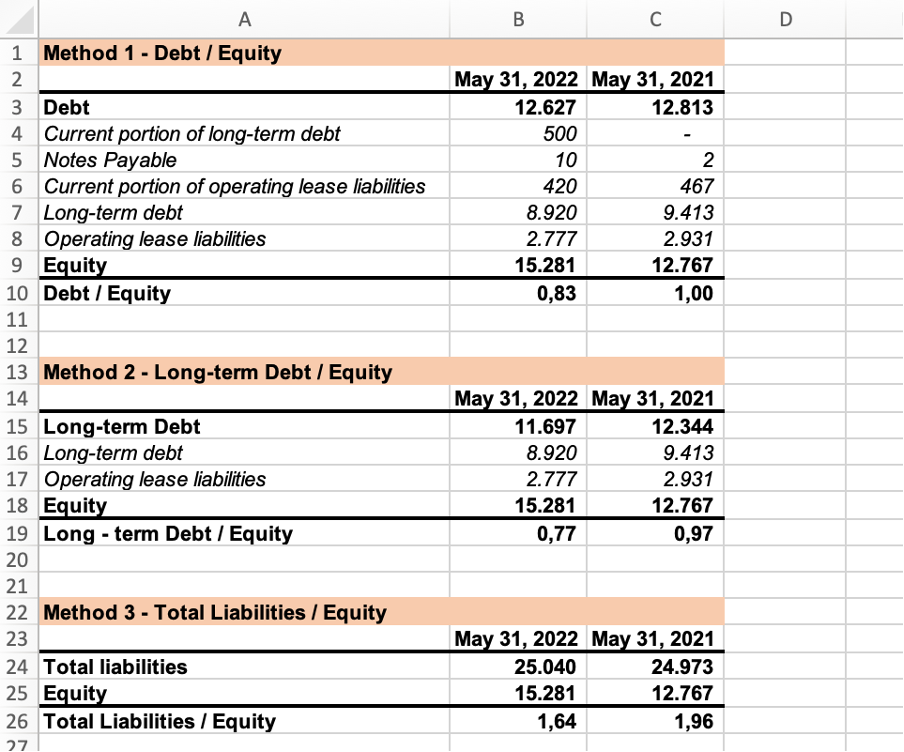
At this point, you should be able to proceed with the calculation. As mentioned earlier, the ratio doesn't tell you anything unless you can compare it with something. Therefore, for this example, year-over-year change will be calculated.

The ratio was calculated using the three formulas discussed above. The total liabilities amount was obtained by subtracting the Total shareholders' equity amount from the Total Liabilities and Shareholders' Equity amount.
Results show the proportion of debt financing relative to equity financing. As we can see, NIKE, Inc.'s Debt-to-Equity ratio slightly decreased year-over-year, primarily attributable to increased shareholders' equity balance.
What Does D/E Ratio Tell You?
The Debt-to-Equity (D/E) ratio is used to evaluate a company's leverage, specifically its level of debt relative to its equity. It indicates how much debt a company is using to finance its operations compared to the amount of equity.
A high D/E ratio suggests a company relies heavily on borrowing to finance its growth or operations. This can increase financial risk because debt obligations must be met regardless of the company's profitability.
On the other hand, a low D/E ratio indicates a more conservative financial structure, where the company relies more on equity financing.
Investors and analysts use the D/E ratio to assess a company's financial health and risk profile. A high ratio may indicate the company is more vulnerable to economic downturns or interest rate fluctuations, while a low ratio may suggest financial stability and flexibility.
Note
It's essential to consider industry norms and the company's specific circumstances when interpreting the D/E ratio, as what may be considered high or low can vary across different sectors and business models.
What is a good Debt-to-equity ratio?
There is no correct answer to this question. The ratio heavily depends on the nature of the company's operations and the industry in which the company operates.
Companies within financial, banking, utilities, and capital-intensive (for example, manufacturing companies) industries tend to have higher D/E ratios. At the same time, companies within the service industry will likely have a lower D/E ratio.
Some other things to keep in mind:
- Lenders and debt investors prefer lower D/E ratios as a lower ratio means less dependence on debt financing and, therefore, less risk.
- Shareholders might prefer a lower D/E ratio because there will be fewer claims on the company's assets with higher seniority in case of liquidation.
- While a lower D/E ratio may suggest less reliance on debt, it could also signify prudent financial management and reduced risk exposure.
- A higher D/E ratio can lower the company's weighted average cost of capital as the cost of debt is typically lower than the cost of equity.
- If the D/E ratio is too high, the cost of debt will increase, driving along the cost of equity and causing the company's weighted average cost of capital to rise.
In certain circumstances, the debt-to-equity ratio can become negative. As you might know, the accounting equation implies that,
Assets = Liabilities + Shareholders’ Equity
This means that,
Shareholders’ Equity = Assets – Liabilities
Thus, equity balance can turn negative when the company's liabilities exceed the company's assets. Negative shareholders' equity could mean the company is in financial distress, but other reasons could also exist.
A negative shareholders' equity results in a negative D/E ratio, indicating potential financial distress. It's crucial to investigate the underlying reasons for this imbalance.
Note
Generally, a D/E ratio below one may indicate conservative leverage, while a D/E ratio above two could be considered more aggressive. However, the appropriateness of the ratio varies depending on industry norms and the company's specific circumstances.
Limitations of D/E Ratio
Among some of the limitations of the ratio are its dependence on the industry and complications that can arise when determining the ratio components.
- Interpretation: As mentioned earlier, the ratio heavily depends on the nature of the company's operations and the industry in which the company operates. This complexity makes it difficult to interpret the obtained results.
- Determination of the components: One common question when classifying the ratio components is where the preferred stock falls. Certain characteristics of preferred stock, such as preferred dividends, par value, and liquidation rights, blur the line between debt and equity. However, since preferred dividends are not mandatory and preferred stock ranks below all debt obligations, it may be classified as equity.
D/E Ratio vs. Leverage Ratios
Some of the other common leverage ratios are described in the table below.
| Ratio | Formula | Description |
|---|---|---|
| Debt to Assets ratio | Total Debt / Total Assets | Compares the company's debt to its assets. |
| Debt to Capital ratio | Total Debt / (Total Debt + Total Equity) | Helps determine how much debt the company uses compared to capital. |
| Debt to EBITDA ratio | Total Debt / Earnings Before Interest Taxes Depreciation (EBITDA) | Shows how long the company will take to pay off its debt, assuming that the EBITDA is kept constant. |
| Asset to Equity ratio | Total Assets / Total Equity | Describes how much of the company's assets are financed by the shareholders' equity. |
The ratio indicates the extent to which the company relies on debt financing relative to equity financing. In other words, it measures the proportion of borrowed funds utilized in operations relative to the company's own resources.


or Want to Sign up with your social account?