Boston Consulting Group (BCG) Matrix
A business planning tool used to assess the strategic position of a company's brand portfolio


What Is A Boston Consulting Group (BCG) Matrix?
One of the most often used techniques for portfolio analysis is the BCG Matrix or the Boston Consulting Group growth-share Matrix. Introduced in 1970 by BCG, it is a business planning tool used to assess the strategic position of a company's brand portfolio.
The growth-share matrix is a portfolio management model that aids firms in determining which among their various businesses to prioritize. It is also known as the product portfolio matrix.
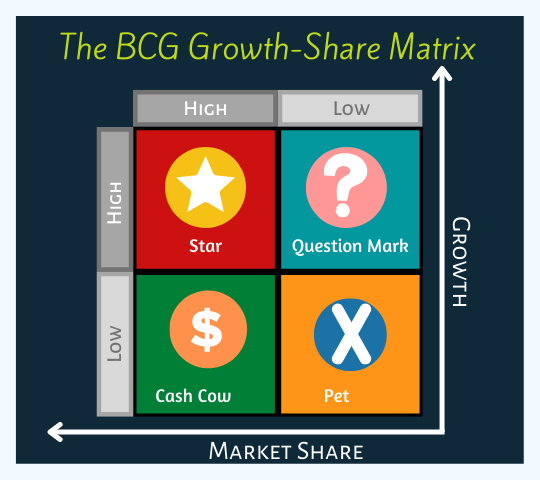
The Product Portfolio matrix assigns a two-by-two matrix classification to a company's goods and services. Each quadrant is represented by a distinct symbol, indicating varying levels of market share and growth rate. The symbols are:
- Stars
- Question marks
- Cash cows
- Dogs
Executives could then choose where to allocate their resources and cash to achieve the most value and where to eliminate their losses by classifying each organization into one of these four categories.
- The BCG Growth-Share Matrix is a business planning tool used to assess the strategic position of a company's brand portfolio. It is also known as the product portfolio matrix.
- The BCG matrix assigns a two-by-two matrix classification to a company's goods and/or services. Each quadrant has a different symbol that denotes a different level of profitability depending on the market share and growth:
- Stars: High Market Share, High Growth
- Question marks: Low Market Share, High Growth
- Cash cows: High Market Share, Low Growth
- Dogs: Low Market Share, Low Growth
- The matrix displays two aspects that firms should take into account when determining where to invest: Firm competitiveness and Market attractiveness.
- The matrix is not a prediction tool but a tool for making decisions and, thus, may not always account for all the variables that a company will eventually have to deal with.
- The relevance of the growth-share matrix has evolved, and now, it has to be implemented more swiftly and with a greater emphasis on strategic experimentation to allow adaptation to a more volatile corporate environment.
Understanding a BCG Growth-Share Matrix
The BCG Matrix is a valuable tool for strategic planning that helps businesses determine where to allocate their resources based on two critical factors: firm competitiveness and market attractiveness.
These factors are primarily influenced by a company's relative market share and the growth rate of the markets in which it operates.
The matrix divides the product or the business unit into four equal quadrants that reflects a certain mix of growth and market share as compared to the other quadrants:
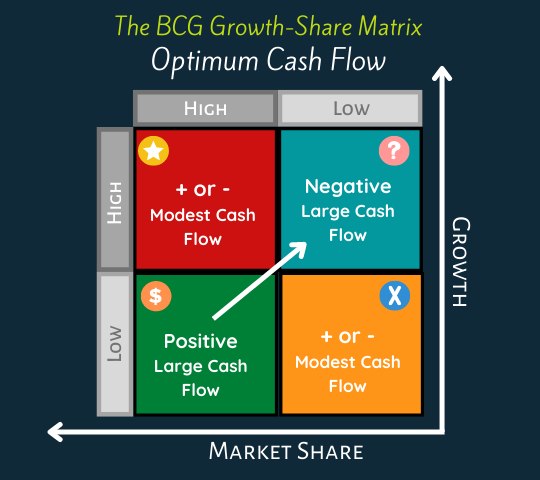
- Cash Cows (High Share and Low Growth Rate): Businesses should extract the cash from these "cash cows" to reinvest in other areas or quadrants
- Stars (High Share and High Growth Rate): Because of their significant future potential, businesses should heavily invest in these "stars" as they have the potential of becoming a cash cow
- Question Marks (Low Share and High Growth Rate): Depending on their potential to become stars, businesses should either invest in them to enhance market share or consider phasing them out
- Dogs (Low Share and Low Growth Rate): These are the products with low market share in slow-growth industries. Businesses should evaluate their strategic purpose; if there's no clear path to market leadership, they should consider liquidation, sale, or repurposing.
The ability of a company to secure a dominant market share before growth ceases determines the value of its products.
Note
The matrix is not a prediction tool but a tool for making decisions. Thus, it may not always account for all the variables a company will eventually have to deal with.
For instance, gaining a more significant market share might cost more than the increased income from new sales. Businesses must carefully plan for contingencies because product development might take years.

Quadrants of the BCG Matrix
Each quadrant of the matrix denotes a different level of profitability, need for financing, and cash flows, and each quadrant has unique characteristics.

1. Stars: High Market Share, High Growth Rate
The Star quadrant consists of the business units or products with high market share in a rapidly expanding industry.
This quadrant consists of market-leading products and business units that need a lot of investment to keep their market position, accelerate growth, and preserve their competitive edge. As a result, they generate large cash flows while also consuming the funds.
These are a company's most cherished property and are at the forefront of its product line. Stars may transition into cash cows as the market matures while the products remain successful.
2. Question Mark: Low Market Share, High Growth Rate
Question marks denote business units and products with a low relative market share in an industry experiencing rapid expansion. They need an excessive amount of investment to keep or expand their market share. A careful evaluation is necessary to determine if the business can thrive.
Generally speaking, question marks represent brand-new products and services with a promising commercial future. There is no precise strategy that may be used.
If the company believes it has a dominant market share, it can pursue an expansion; otherwise, it can pursue a retrenchment strategy. Most companies begin as question marks when they attempt to join an industry with significant growth and an existing market share.
Most companies start as question marks when entering an industry with significant growth and existing market share. Unfortunately, if they fail to establish themselves as market leaders, they can eventually become dogs as market growth slows.
3. Cash Cows: High Market Share, Low Growth Rate
Cash Cows are products with a significant market share in an established, slowly growing field. Cash cows are businesses that need low capital investment and produce cash that may be invested in other company units.
These business units or products, primarily the core business, are the company's main cash source. They serve as the foundation of an organization. Typically, these companies employ stability tactics.
Cash cows produce significant cash flows, typically used to fund stars and question marks.
Business units in the cash cows quadrant are said to be "milked" because they require the least capital investment while still generating profits. If cash cows lose their appeal and decline, a retrenchment strategy may be considered.
If cash cows lose their appeal and decline, a retrenchment strategy may be considered.
4. Dogs: Low Market Share, Low Growth Rate
Dogs represent products and business units with low market shares in slow-growing industries. Therefore, they neither need huge investments nor generate high cash flows.
These units face cost disadvantages due to their limited market share and typically employ retrenchment tactics since acquiring market share often comes at the expense of rival enterprises.
Due to factors such as high expenses, product defects, or inefficient marketing, products and business units in this category have a small market share.
If a dog has a lower chance of securing market share, it should be liquidated unless it has another strategic objective such as being complementary to existing products or competitive advantage.
Benefits of BCG Matrix
The challenge of resource distribution across various business units typically arises in large corporations that need to establish business units. The matrix was created to aid companies with the management of various business divisions.
The following are the benefits of the growth-share matrix:
1. Effective Tool for Resource Allocation
The BCG Matrix is a valuable management tool that provides a suitable framework for directing resources among different units. Managers can easily compare the performance of various company divisions, aiding in efficient resource distribution.
2. Simplified Approach
The BCG matrix helps in solving different and complex business factors. This simplification can help the employees to design and develop new strategies.
3. Encourage Better Decision-Making
The growth-share matrix enables comparisons between a company's growth and development rate and the average growth rate for that particular industry.
Furthermore, this specific matrix is easy to use, fostering improved decision-making.
4. Relevant Support and Guidance
The BCG matrix may be among the first ever created, but is also the most popular and well-known matrix taught globally.
Due to the popularity of the BCG matrix, there are forums on the internet where people discuss the best ways to use it. Whether you are new to the matrix or a frequent user, there is a supportive community to help you harness its potential.
The BCG matrix is still useful and efficient for allocating resources and assuring higher earnings.
Limitations of BCG Matrix
With the BCG Matrix, comparing several business units and creating a structure for allocating resources among various business units is easily possible. However, it does have certain restrictions.
These restrictions are:
1. Inadequate Classification
The BCG Matrix typically classifies businesses as low, medium, or high performers. As a result, the actual nature of business might not be shown.
2. Undefined Market
The BCG matrix has the drawback of not showing the boundaries of the market precisely. This can lead to determining the inaccurate market dynamics.
3. High Expenses
A large market share does not necessarily translate into high earnings. A large market share also comes with high expenses that can impact the company's overall profitability.
4. Limited Profitability Metrics
The sole indications of profitability are growth rate and relative market share. This approach excludes and dismisses other profitability metrics that can give crucial business insights.
5. Undermining of "Dogs"
While "dogs" are typically viewed as low performers, they can occasionally provide competitive advantages or generate more profits than "cash cows" in certain situations. Dismissing them entirely may lead to missed opportunities.
6. Basic Strategy
This two-by-two matrix strategy is seen to be overly basic for certain complex business structures.
BCG Matrix Different Sequences
Companies work around different strategies to avail certain goals and strategic decisions. Let us see three different instances below:
1) Optimum Cash Flow
To achieve optimum cash flow using the BCG Matrix:
-
Cash Cows: These are profitable, well-established products. Maximize cash flow from them.
-
Question Marks: These are products with growth potential but low market share. Invest in them to become future Cash Cows.
By moving from Cash Cows to Question Marks, you aim to grow and diversify your cash flow sources, optimizing your overall financial performance.
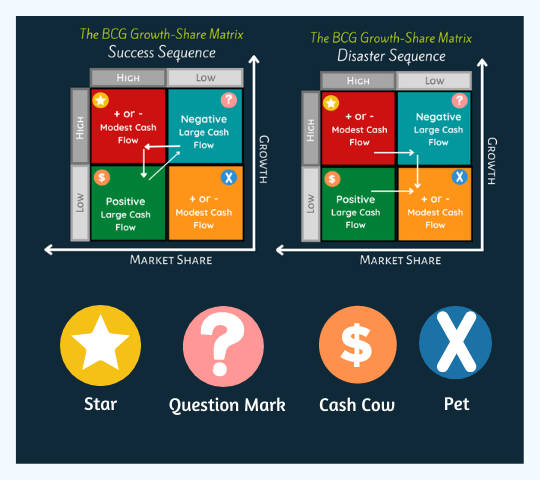
2. Disaster Sequence
The disaster sequence in the Boston Matrix might occur due to poor decision-making.
Let us see how this works below:
- Introduction (Question Marks): Products that fail to gain traction in high-growth markets start in the Question Marks quadrant and may face challenges.
- Trouble (Disaster): In this phase, products struggle to compete and may become resource-draining. It's essential to either turn them around or phase them out to minimize losses.
- Decline (Dead Dogs): If the issues are not resolved, products in the Trouble phase may continue to decline until they become essentially "Dead Dogs." At this point, they are typically discontinued.
3. Success Sequence
Firms may achieve success by following certain strategies:
- Introduction (Question Marks): Start with new products or business units in the Question Marks quadrant. These have low market share in high-growth markets. The goal here is to turn them into Stars.
- Growth (Stars): As successful Question Marks transition into Stars, they achieve high market share and growth. Invest in them to further grow and maximize their potential.
- Maturity (Cash Cows): Over time, Stars can mature into Cash Cows. Cash Cows have high market share but are in low-growth markets. The focus here is on extracting maximum cash flow from these stable products.
- Decline (Dogs): Cash Cows can eventually decline and become Dogs if not managed properly. Dogs have a low market share in low-growth markets and require careful consideration regarding their future.
Relevance Of The BCG Matrix In The Modern Economy
In today's dynamic business environment, the BCG Matrix has evolved significantly. To allow adaptation to a more volatile corporate environment, it has to be implemented swiftly and with a greater emphasis on strategic experimentation.
The matrix requires a new relevant competitiveness metric to replace its horizontal axis, as market share is no longer an effective performance indicator. Organizational behavior must be more thoroughly ingrained with the matrix's usage for strategic experimentation.
Companies should concentrate on the following four operational principles to optimize the matrix for effective experimentation in the current business world:
1. Accelerate Strategy Timer
It is essential to assess the portfolio regularly. In addition, shorter planning cycles and feedback loops demand streamlined approval procedures for investment and liquidation choices.
Hence, businesses should accelerate their strategic timer to maintain pace with the environment.
2. Balanced Exploration and Exploitation
Achieving equilibrium between high-growth prospects ("question marks") and established assets ("cows" and "dogs") is always necessary. This can be done through the following:
- Increase the number of question marks: This needs a culture that embraces uncertainty, rewards risk-taking, and accepts failure.
- Quickly and efficiently check question marks: Swiftly and efficiently evaluate "question marks" through methods like virtual testing, reducing the cost of experimentation.
- Effectively milk cows: Successful businesses recognize the need to capitalize on current competitive advantages. They exploit low-growth business units by increasing profitability through continuous innovations and operational optimization.
- Maintain a short leash for all dogs: Failure is a part of experimentation. The "dogs" can signal opportunities for future experiments and efforts that should be made to extract residual value before divestment.
Despite Bruce Henderson's claim that dogs have little significance, successful firms now use "dog" failure signals to guide future decisions about where and how to conduct experiments.
3. Choose carefully
Companies must carefully choose both investments and divestitures.
To decide which question marks should be upgraded through additional investment and which dogs and cows should be proactively divested, successful organizations use a variety of data sources and build predictive analytics.
4. Evaluation and management of the portfolio economics of experimentation
Long-term sustainability requires a thorough understanding of the level of experimentation necessary to sustain growth. This can be achieved through the following:
- Regulate the pace of experimentation: To keep their pipeline full, successful businesses must continuously monitor and control the volume and expense of the question marks they generate.
- Boost the success of new products and businesses: To sustain growth from fresh goods, companies must ensure that the odds of question marks becoming stars are high enough and that the cost of their failing is bearable.
- Maintain a balanced portfolio: Successful businesses aim for today's stars and question marks to eventually provide sufficient profitability to replace cows and dogs later in their life cycles.
This is done so that the business portfolio eventually generates enough profitability.

Researched and authored by Aqsa Wasif | LinkedIn
Free Resources
To continue learning and advancing your career, check out these additional helpful WSO resources:


or Want to Sign up with your social account?