Accumulation/Distribution Indicator (A/D)
A cumulative indicator that evaluates whether a stock is being dispersed or accumulated using volume and price.


What is Accumulation/Distribution Indicator (A/D)?
The accumulation/distribution indicator (A/D) is a cumulative indicator that evaluates whether a stock is being dispersed or accumulated using volume and price. This metric looks for differences between the volume flow and the stock price.
The A/D indicator sheds light on how robust a trend is. For example, if the price is growing, but the indication is declining, there may not be enough buying or stockpiling volume to support the price increase, and a price decline may be on the horizon.
Marc Chaikin developed this indicator to measure whether money flows into or out of a security over time. This indicator is considered one of the most widely used volume indicators.
Before diving into technicalities, let's understand the literal meaning of accumulation, which means a mass or quantity of something that has gradually gathered or been acquired. In our case, securities distribution is how something is shared among a group or spread over an area. The group here is investors.
- A/D measures money movement in/out of stocks via volume and price, indicating trend strength and potential reversals.
- Volume confirms trends, identifies bullish/bearish signs, and hints at market exhaustion or reversals, pivotal in technical analysis.
- A/D's calculation involving money flow and volume reflects supply-demand dynamics impacting prices, aiding trend confirmation or signaling divergences for potential shifts.
- A/D confirms trends and spots divergences but might miss price gaps and can't consistently predict reversals due to its derivative nature from price and volume.
Why Volume?
Hold on, science geeks; volume is not the "space occupied by matter" we use in science. Instead, it has something to do with transactions.
Every transaction between buyers and sellers determines a security's volume. Every time a buyer requests to purchase what a seller is offering at a specific price, there has been a single transaction.
A day's volume would be X transactions if X transactions occurred on that given day. Volume is the total amount of security or asset that has been traded over time, usually in a single day.
Volume is a key aspect of technical analysis, and many indicators have been developed to track its movement. A/D is one such indicator.
Since prices move more frequently when there is greater activity, investors may also track a security's tick volume or the number of price fluctuations in a contract.
Traders can learn about market activity and liquidity via volume. Increased liquidity, better order execution, and a more active market bringing buyers and sellers together all result from higher trade volumes for a given asset.
Futures trading activity tends to rise when investors are uneasy about the stock market's direction, frequently leading to more active trading in options and futures on individual equities.
High-frequency traders (HFTs) and index funds have contributed significantly to U.S. market trading volume statistics. HFTs view volume as a crucial indicator for assessing the significance of market changes.
During a given timeframe, if the market moves substantially, the credibility of that movement's strength increases or decreases based on the volume traded.
Indicators From Volume
Observing volume patterns over time, we can gain insight into the level of conviction driving advances and dips in particular stocks and even entire markets. The same holds true for options traders, as trading volume verifies the current interest in an option.
Volume significantly impacts technical analysis and is displayed among several key technical indicators.
Some critical aspects of volume can provide insight into
1. Trend confirmation
Increased volume is expected in a growing market. To keep prices higher, buyers must continue to buy in more significant quantities and with greater zeal. A probable reversal is signaled by rising costs and falling volume, indicating a lack of confidence.
2. The bulls are winning:
Volume might help you spot bullish indicators. Imagine, for instance, that volume rises as the price declines, then the price swings higher, then moves back down.
It is typically considered a bullish indicator if the price does not drop below the prior low on the move back down and volume decreases on the second decline.
3. Exhaustion in the market
We can observe depletion moves in both rising and falling markets. These tend to be abrupt price changes accompanied by a sharp rise in volume, which denotes the probable end of a trend.
At market tops, participants who waited and are concerned about missing out on more of the move pile in, exhausting the pool of purchasers.
4. Price and volume reversals
After a significant price increase or decrease, if the price starts to range with substantial volume but little price movement, this may signal that a reversal is about to take place, and prices will reverse course.
We have gained insight into why volume is essential and how it can provide important indications. Now, we will learn about the accumulation/distribution indicator (A/D), one of the most widely used indicators.
The Accumulation/Distribution Indicator (A/D) Formula
The formula for calculation is:
MFM = [(Close-Low) - (High-Close)]/ High-Low
A/D = Previous A/D + CMFV
Money Flow Volume = MFM * Period Volume
Where:
- MFM = Money Flow Multiplier
- Close = Closing price
- Low = Low price for the period
- High = High price for the period
- CMFV = Current period money flow volume
The money flow multiplier can be between +1 and -1. The multiplier is positive if the stock's closing price is in the upper half of the High-Low range and negative if it is in the bottom half.
let us see how to calculate the A/D Line:
- Calculate the multiplier first. To calculate, find the close, high, and low of the most recent period.
- To determine the money flow volume, multiply the current period's volume by the multiplier.
- The final value is multiplied by the money flow volume. Use the money flow volume as the first value in the first calculation.
- Repeat the procedure after each period, adding or deducting the new money flow volume from the total, which gets us the final value.
- The multiplier used in the calculation indicates how vigorous the buying or selling was at a particular time. It accomplishes this by assessing whether the price closed in the higher or lower part of its range.
What Does the Accumulation/Distribution Indicator (A/D) Tell You?
The A/D line demonstrates how factors affecting supply and demand are affecting price. A/D may move in the same or opposite direction as price fluctuations.

The value of the multiplier is multiplied by the volume. Hence, a stock will see a significant A/D rise when it closes close to the period's high and has substantial volume.
-
The upward trend will likely continue when the stock price and the indicator both experience higher peaks and higher troughs.
-
The downward trend is expected to continue when both the stock price and the indicator have lower peaks and troughs.
-
If the indicator increases for a certain period, accumulation (buying pressure) may be higher and hint at the upcoming upward breakout.
-
If the indicator declines for a specific time frame, distribution (selling pressure) may be higher and hint at the upcoming negative breakout.
-
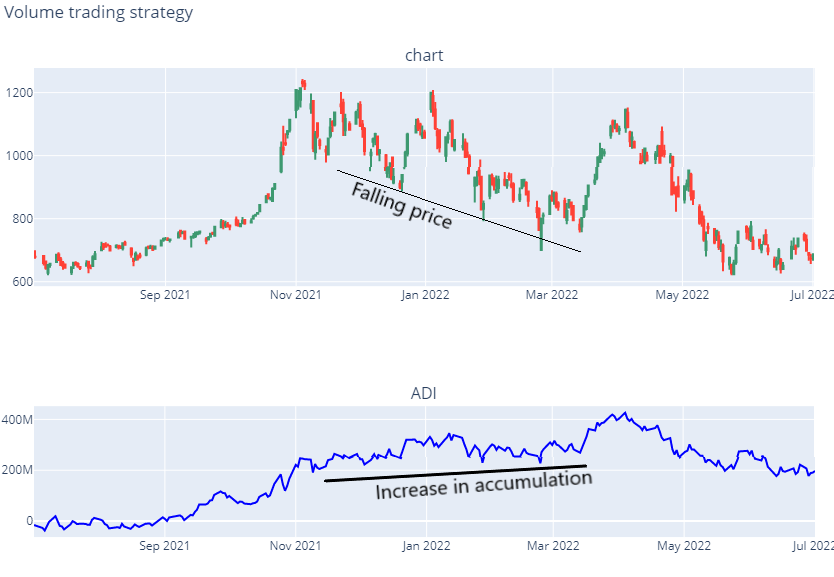
The increasing trend will likely stall if the stock price rises while A/D declines. We refer to this as a negative divergence.
-
The downward tendency may slow if the stock price keeps dropping while the accumulation dispersion increases. This is known as a positive divergence.
The A/D line's steepness in bullish and bearish periods sheds light on the trend. A significantly increasing line indicates a similarly significant price increase. As there is still plenty of distribution, prices will likely continue falling if both the price and the line show a downward trend.
Advantages of the A/D Indicator
The major pros are considering volume to identify trends and divergence of security.
1. Trend confirmation
The idea of trend confirmation is relatively simple. An upward trend on the price chart is supported by an upward trend in the accumulation/distribution line and vice versa.
2. Divergences
Bullish and bearish divergences are easily spotted using A/D. A bullish divergence is created when the price falls to new lows, but the accumulation/distribution line does not confirm these lows and moves higher.
A rising accumulation/distribution line demonstrates accumulation. Consider this to be essentially covert buying pressure. Technical analysts should watch for a bullish turnaround on the price chart based on the idea that volume comes before price.
Disadvantages of the A/D Indicator
The accumulation distribution indicator has certain limitations. These are as follows:
1. Inability to Signal Price Changes Between Periods
Since the A/D indicator does not signal price changes between periods, a string of price gaps could go unnoticed.
2. Derivative Nature from Price and Volume
The accumulation/distribution line is a derivative of price and volume-based indicators. As a result, it is at least two steps away from the underlying security's actual price. The money flow multiplier does not account for price variations over time.
For instance, stock gaps are down by 10% on extremely high volumes. Although the price fluctuates all day and closes in the upper part of its daily range, it is still down 18% from the previous close. The A/D would increase as a result of such a shift.
Despite the stock's considerable value loss, it ended the day in the higher part of its daily range. Thus, the indicator will likely climb dramatically due to the high volume. Traders should note these potential anomalies on the price chart since they may alter how the signal is read.
3. Inability to Independently Confirm Trends
A/D lacks autonomy and cannot be anticipated to consistently confirm price action or correctly forecast price reversals with divergences. Moreover, prices and indications can diverge from one another occasionally.
This is the reason the accumulation/distribution line cannot confirm a trend independently without using other indicators.
Divergences are poor timing signals because they might last for a long time and may not be helpful in short-term trading.
The divergence between the indicator and price does not necessarily predict an impending reversal. The price may not reverse at all, or it may take a very long time.
Accumulation/Distribution Indicator vs. On-Balance Volume
The on-balance volume (OBV) meter, a technical trading momentum indicator that uses volume flow to forecast changes in stock price, was initially created by Joseph Granville.
Granville created OBV to predict when significant changes in the markets would occur based on changes in volume since he believed that volume was the driving force behind markets.
He compared the predictions made by OBV to "a spring being wound tightly" in his book, “Granville's New Key to Stock Market Profits.”
The accumulation/distribution line and on-balance volume are momentum indicators that use volume to forecast the movement of "the smart money." However, the parallels stop there.
OBV determines if the current closing price is higher or lower than the previous closure. The period's volume is added if the close is higher. The period's volume is deducted if the finish is lower.
The actual individual quantitative value of OBV is not significant, despite being shown on a price chart and quantified. Since a certain starting point determines the time interval and the indicator itself is cumulative, the real number value of OBV depends arbitrarily on the start date.
The A/D indicator utilizes a multiplier depending on where the price closed within the period's range rather than considering the previous close. As a result, the indicators' computations and their content may also vary.
| Criteria | Accumulation/Distribution Indicator (A/D Indicator) | On-Balance Volume (OBV) |
|---|---|---|
| Creator | Developed by Marc Chaikin | Developed by Joseph Granville |
| Objective | Measures the flow of money into or out of a security | Forecasts price movements based on changes in volume |
| Philosophy | Considers the relationship of closing price and range | Views volume as the primary market driver |
| Calculation Method | Considers price's position within the period's range | Compares current close to previous close for volume analysis |
| Volume Consideration | Volume multiplies by price's position in range | Adds/deducts volume based on price's close relative to prior close |
| Numerical Significance | Cumulative, arbitrary based on start date | Cumulative, value relative to a chosen starting point |
Analysis Using a Combination of Indicators
While employing the A/D line by itself to get profits is technically impossible, adding MFI, the stochastic indicators, or both have the potential to be far more beneficial. MFI and the stochastic indicators can highlight extreme conditions that the A/D line was not intended to spotlight because they offer ranges.
While both the stochastic indicators and MFI aim to identify overbought or oversold levels, they approach the task differently:
Whether money flows in a positive or negative direction, MFI tracks that flow. In addition to the A/D line, these technical tools can be utilized because they don't overlap.
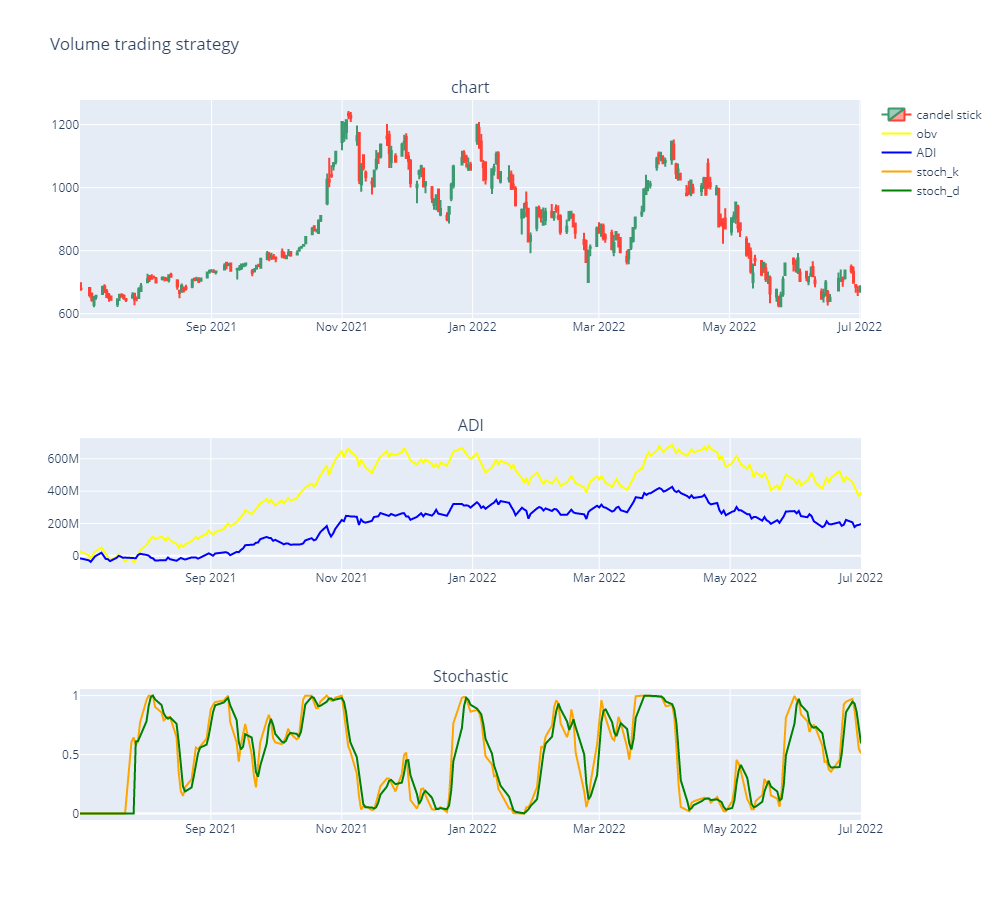
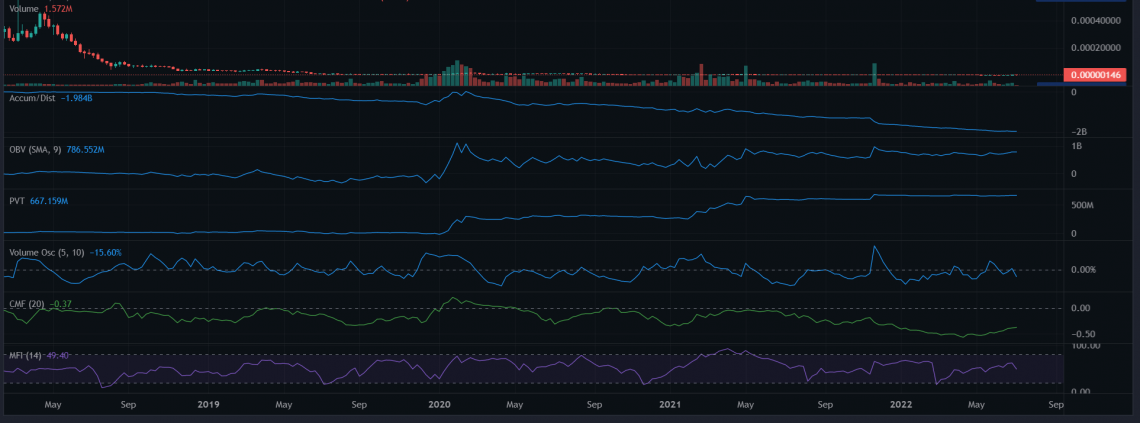
Above is a graph of tesla stock for one year. As you can see, the ADI index kept increasing from January to March or at least held constant. This indicates accumulation.
On the other hand, the stochastic oscillator swung between the overbought and oversold regions but mainly remained in the oversold region. Ultimately, the price fell. This is a classic example of how using a single indicator can be misleading.
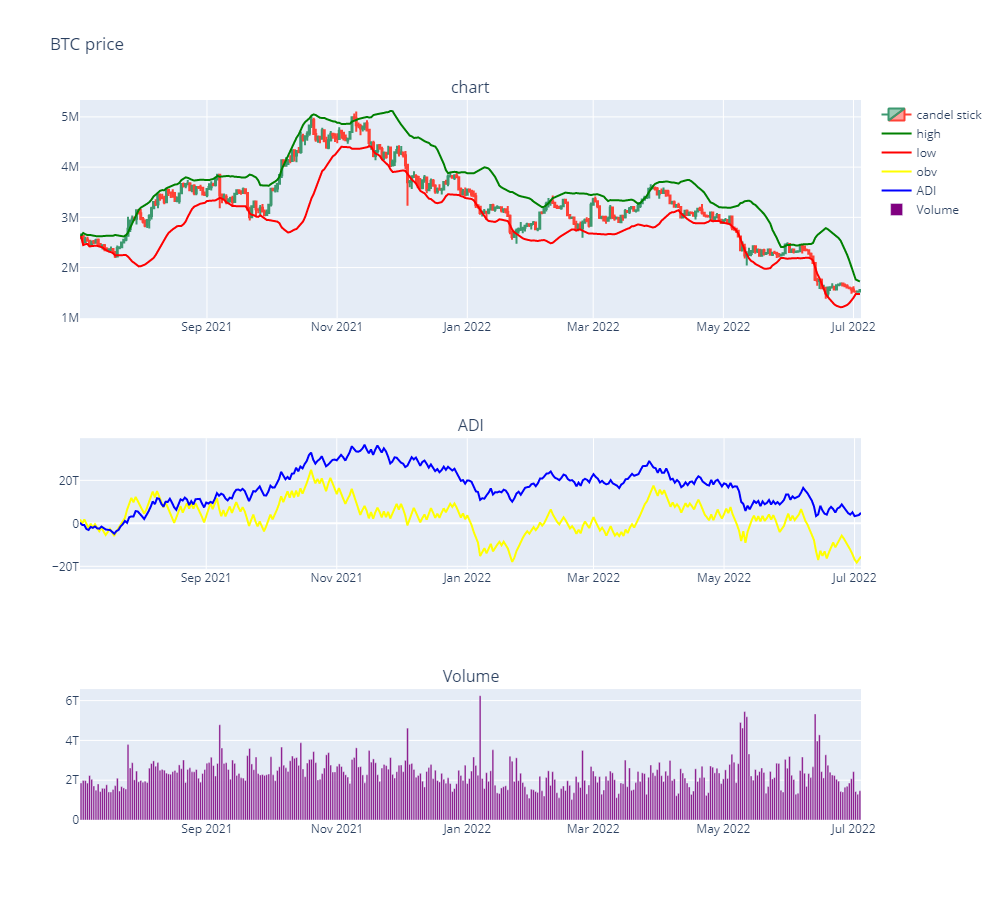
For inherently volatile assets like Bitcoin, the addition of Bollinger bands can help in identifying a trend. Security is generally considered overbought if it is above the green bar and oversold under the red band.
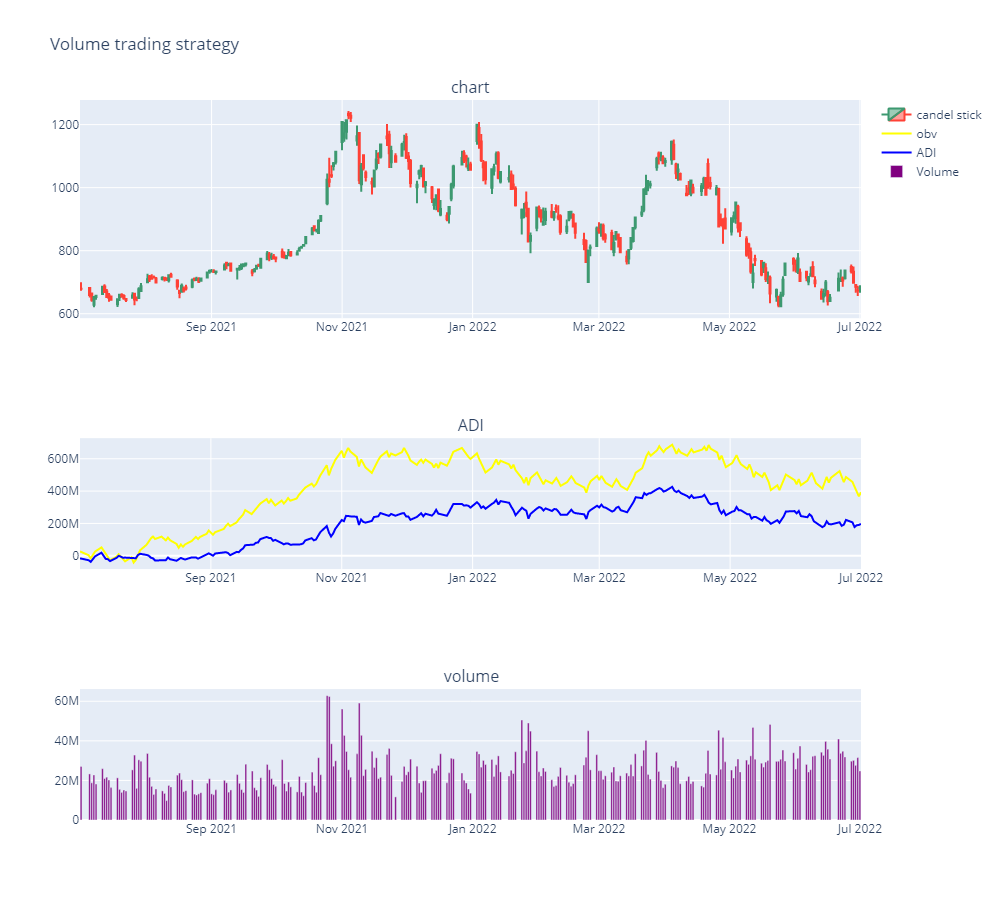
These trends can be confirmed by noticing a spike in the volume of shares traded and comparing it with the slope of ADI.


or Want to Sign up with your social account?