ADX Indicator – Technical Analysis
A technical analysis tool was invented by technical analyst Welles Wilder to measure trend strength.


What is ADX Indicator?
The Average Directional Movement Index, abbreviated ADX, is a technical analysis tool invented by technical analyst Welles Wilder to measure trend strength. Originally it was developed for trading commodity futures.
Finding the trend is one of the most important things for most traders before placing any trades. This article will dive into the most underrated technical indicator: the Average Directional Movement Index, and give hints on applying it in your trading.
Still, this index is widely used in other tradable financial instruments, like stocks, commodities, cryptocurrency, mutual funds, exchange-traded funds (ETFs), and futures.
The average directional movement index is a graphical line ranging from 0 to 100, representing the trend strength of the price movement of an asset over time. It does not show directional movement (i.e., rising or falling price).
Thus, this indicator is usually used with the Directional Movement Index (DMI), which shows the directional movement in price.
When the positive Directional Movement Index (+DI) crosses the negative Directional Movement Index (-DI), it represents an uptrend in the market, and the Average Directional Index shows the trend's strength.
Conversely, when the -DI crosses the +DI, the market is in a downtrend, yet the Average Directional Index also shows the trend's strength.
- The Average Directional Index (ADX) is a technical analysis tool used to measure the strength of a trend in a market, whether it is an uptrend or a downtrend.
- ADX is derived from the smoothed average of price movements, focusing on the strength rather than the direction of the trend. It is calculated using the directional movement indicators (+DI and -DI).
- ADX values typically range from 0 to 100. Higher ADX values indicate a stronger trend, while lower values suggest a weaker or non-existent trend.
- ADX does not provide information about trend direction or future price movements. It is best used in conjunction with other technical indicators and analysis tools to make informed trading decisions.
ADX Indicator Calculation
Before calculating the index, both a Positive Directional Movement Index (+DMI) and a Negative Directional Movement Index (-DMI) need to be estimated to have the Directional Movement Index (DX).

Steps of calculating the index:
1. Calculating the Directional indicator (Di)
+DI14 = [+DI14/ TR14] * 100
-DI14 = [-DI14/ TR14] * 100
True volatility (TR) is the highest volatility of the stock price fluctuation within 14 days. The directional movement indicator is within this range, so the direction indicator (DI) value will be between 0 and 100.
For example, +DI14 = 54, –DI = 32, which means that in the past 14 days, the upward trend accounts for 54%, the downward trend accounts for 32%, and the remaining percentage has no direction.
2. Calculating the Directional Movement Index and Average Directional Movement (ADX)
DX = [(+DI14) - (-DI14)]/ [(+DI14) + (-DI14)]
Taking the absolute value of DX from the calculation makes it possible to determine the moving average of DX to have an Average Directional Index.
- Average Directional Index settings. Most traders follow the original set of 14 periods, but it varies depending on the user's intention.
- Lower settings (below 14 times periods). It creates a quicker reaction of the Average Directional Index towards price movement, but more false signals are given.
- Higher settings (above 14 times periods). There will be fewer false signals, yet the reaction time will lag because the index will measure only a stronger trend until it is formed.
The ADX on a Chart
The index is shown in a separate window below or above the price action window on a trading chart. The index is a line that ranges from zero to 100, indicating the trend strength rather than the trend direction.
The index is often combined with the +DMI and the -DMI lines. In the original work of Wilder, he imagined using +DMI and -DMI as the trend direction indicator and the Average Directional Index as the trend strength indicator.
However some technical analysts prefer to use the index alone for two reasons:
- It may be visually confusing when the three lines, +DMI, -DMI, and ADX, intertwine.
- False signals from a crossover of +DMI and -DMI might emerge.
This technical indicator is more reliable for trend strength than a trend direction indicator.
Using the ADX Indicator
The indicator is commonly used in the following ways:
- To ascertain if a market is on a trend or not;
- To verify the strength of a movement;
- To be used as a momentum indicator to signal a potential trend reversal or change.
To ascertain if a market is on a trend or not
25 is the critical level for the technical indicator to determine whether a call is trending.
When the index falls below 25, a market trend is considered weak, and you could expect the market price to bounce between a price range; a phase of accumulation or distribution is in process.
When the index rises above 25, a market trend is considered valid; it is seen as very strong when it rises further above 50. You could expect the market to move in a direction for some time.
To ascertain the strength of a trend
The trend strength is indicated from 0 to 100, determining how strong the trend is.
- below 25: no trend or weak trend
- above 40: a strong trend
- above 50: a confirmed trend
To be used as a momentum indicator to signal a potential trend reversal or trend change
For many technical traders, It is used as an indicator for giving trading signals, and here are some examples how the index might help traders in various trading patterns:
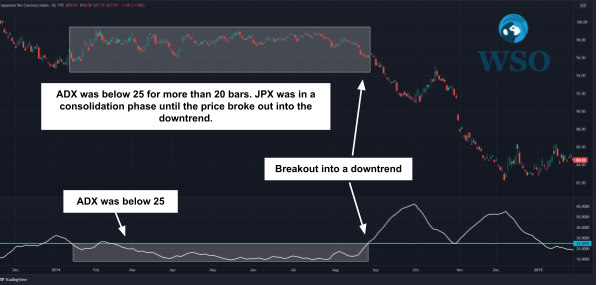
Consolidation Breakout
When the index falls below 25 for more than 20 bars, it is suggested that the market has entered a consolidation phase with a precise price range, forming a price channel. Eventually, the price will break out into a trend with the index uprising.
Trend reversal or consolidation
When the curve is flattened from a steep shape, indicating the trend is losing momentum, the price might result in a possible but not necessary trend reversal or consolidation.

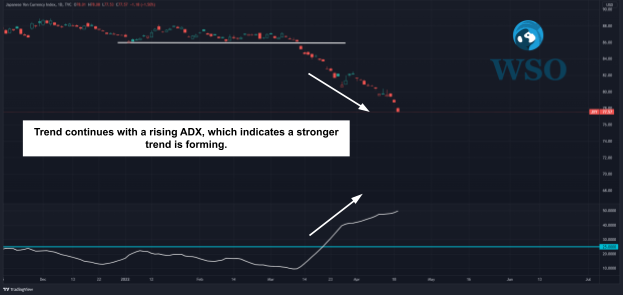
Trend continuation
When the line rises with the market trend, it indicates a trend continuation.
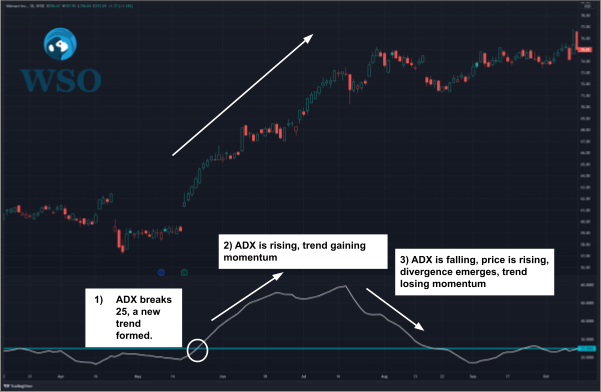
Trend momentum trend
The trend momentum can be observed from the peaks of this indicator.
- When the index's peak rises, the market gains trend momentum.
- When the index's height falls, the market loses trend momentum.
It is usually misunderstood to indicate a trend reversal when the curve falls. However, when the index falls, it only shows signs of a trend losing momentum, not a necessary trend reversal.
Using ADX Indicator with a relative strength index
The ADX-RSI strategy is commonly used in trend trading in the forex market. The ADX determines if a trend is formed, while the Relative Strength Index (RSI) hints at the timing of trading execution.
RSI is one of the momentum oscillators which measure the velocity and magnitude of price movements. It is represented by the value range of 0-100 in 14 bars.
When the RSI is below 30, it indicates that the market is oversold, while when the RSI is above 70, it shows that the market is overbought.
RSI overbought/oversold signals
RSI provides a signal when the market is overbought or oversold. A divergence between the RSI and the price represents a trend reversal.
When the price moves higher with the RSI moving lower, it means a bearish divergence, so there is a potential uptrend reversal.
Conversely, when the price moves lower with the RSI moving higher, it means a bullish divergence and a potential downtrend reversal.
ADX market strength signals
This technical indicator is utilized to measure the trend's strength.
The market is in an accumulation phase when the index line is lower than 25. And when the indicator goes beyond the level of 25, it means the market is in a distribution phase.
Trading with the RSI ADX Trading System
Here are the steps to follow to set up the system.
The technical indicator needs to be higher than 25, indicating a trend forming and signals a possible trading condition. Then check the DMI to determine whether the market is an uptrend or a downtrend.
RSI ADX Trading System Buy Entry Rules
- ADX is above 25
- +DM crosses -DM
- RSI is below 30 (an oversold condition)
- Place a stop loss at the last ADX high
- Place a Buy order and ride the trend
- Take profit when ADX drops below 25.
RSI ADX Trading System Sell Entry Rules
- ADX is above 25
- -DM crosses +DM
- RSI is above 70 (an overbought condition)
- Place a stop loss at the last ADX high.
- Place a Sell order and ride the trend.
- Take profit when ADX drops below 25.
ADX Trading Risks
The Average Directional Index is the calculated exponential moving average of the DIs. It represents the trend strength as a lagging indicator, which means the index can only signal to confirm a trend after it is formed.
- Past data does not guarantee a future result: The technical indicator is generated from the past market movement data, so it is a lagging indicator, and past data may not guarantee a similar result in the future. So, the index is not a perfect indicator to predict the future.
- A Lagging indicator leaves you behind in the market change: The index requires some time to react to the market change. In case of a sudden price change, the hand may not respond in time to signal traders to reflect the market change.
- False signals might emerge: We can confirm a strong trend when the index value is above 25. Yet it may not remain above 25 for long. So if a trader places an order once it hits 25, the market may go against your trade as the index may fall below 25.
It is suggested that traders may combine ADX with other indicators like DMI and MACD. This combination of technical indicators will give you a broader view of the market to make better trading decisions.
Conclusion
The old saying always says: The trend is always your friend. Therefore, confirming your trend is your friend is the cornerstone of trend trading.
The average directional index is one of the underrated technical indicators. Nevertheless, it is beneficial for traders to confirm a trend, avoid false breakouts, or enter a wide market. Therefore, you may consider adding this indicator to your trading gears.
Remember that excepting using this index alone, combining ADX with RSI or other technical indicators could give you better signals for trend prediction.
ADX Indicator FAQs
The three lines are the Directional Movement Index: a Positive Directional Movement index, a Negative Directional Movement Index, and the Average Directional Index.
- The Average Directional Index is a commonly used indicator to determine if a trend is present and show the trend's strength. It is a trend indicator and does not consider trend direction.
- Two other indicators (+DI and -DI) are used to assist the Index. They help to determine trend direction.
Traders use this indicator for various trading setups, especially in breakout pattern trading—for instance, consolidation breakout, trend reversal, or consolidation trend continuation.
The index Crossover means when the Average Directional Index crosses above 25. When this happens, it means a trend may be confirmed. The higher the indicator is, the stronger the movement is.
When there is a divergence between the indicator and price, the market trend maybe reverses soon as the market price rises with a higher high while the Index is making a lower high; it signals that the market momentum is changing, and the market might reverse soon.
The Average Directional Index is a lagging indicator derived from the market price; it might not reflect a sudden market change in time.
No, they are not the same. The Average Directional Index measures the trend's strength, while RSI measures the speed and change of price movements. Traders combined these two technical indicators to form a trading strategy.

Free Resources
To continue learning and advancing your career, check out these additional helpful WSO resources:


or Want to Sign up with your social account?