Breakout
Occurs when a stock or commodity price breaks out of its support or resistance zone after consolidation


What Is A Breakout?
A breakout in finance occurs when a stock or commodity price breaks out of its support or resistance zone after consolidation.
If it breaks out of its resistance level, it shows bullishness in price, which is a sign of strength in price; if it breaks its support level, it shows bearishness in price, which is a sign of weakness in the individual stock.
This is sometimes a confirmed indication of a significant market shift. In actual trading, it refers to a scenario in which the price climbs higher than the initial resistance after breaking out above a resistance level.
When a stock breaks out, traders can buy the stock in anticipation that it will give them a good return in the short term or long term, depending on the time horizon of the breakout and vice versa. Conversely, when a stock breaks its support zone, traders can make money by shorting it.
For it to be convincing, one should look at volumes when the stock is breaking out because when the stock breaks out, there is usually a spurt in volumes. Volatility also increases because there is volatility compression before a breakout.
Also, if there is no volume increase, chances are it is a false breakout because, without high volume, the stock will not hold previous support and come back to previous levels.
These are considered vital in trading because they indicate the start of a new uptrend or downtrend.
-
Breakouts from support or resistance zones in stock prices indicate bullishness (strength) or bearishness (weakness), potentially signaling significant market shifts.
-
Confirming breakouts with increased trading volume is crucial. A lack of volume can indicate a false breakout, where prices may return to previous levels.
-
Traders should enter a stock trade after it successfully breaks out of its consolidation and resistance level with strong volumes. Retesting the previous resistance as new support adds confidence in the breakout's validity.
Questions related to the Breakout
Traders often make this mistake when they enter a stock at the wrong time, mostly in fear of missing out, so how do you ensure that you are not entering in a false Breakout?
When the price appears to break out but then quickly reverses, deceiving everyone who grabbed the breakout's "trap," it can be said that there has been a fake break of the level.
The best way to avoid a false range breakout is to wait two days or more for the price to close outside the resistance level. When this happens, the range will likely end, and the price will start trending again.
When should a Trader take entry in stock after a Breakout?
Traders should enter a stock after it has broken out of its consolidation zone and resistance level with good volumes.
It has then retested its previous resistance level, and now this previous resistance level has become new support. This shows that the stock has successfully crossed over its resistance level.
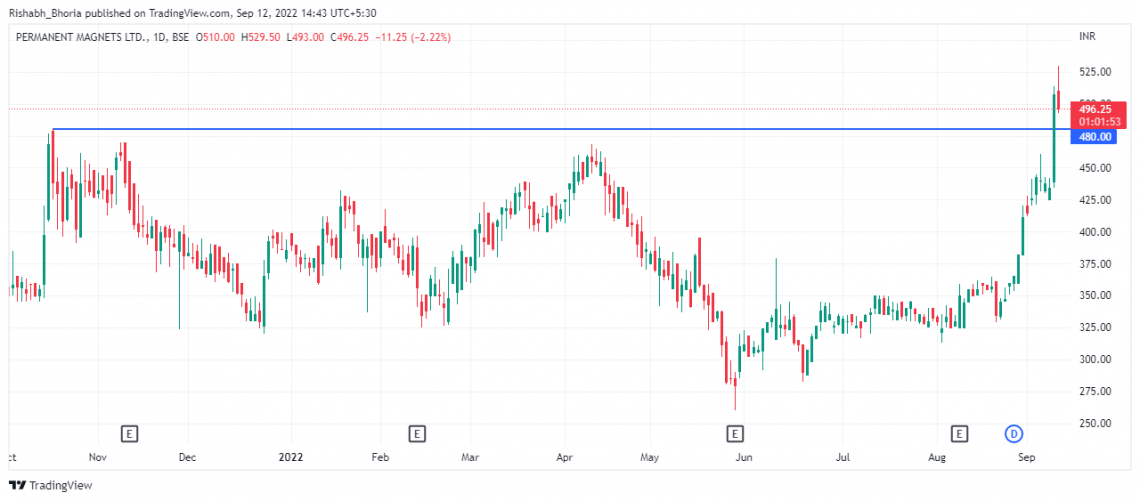
After retesting stock continues its upward momentum and creates new higher highs and higher lows as long as there is strength in the stock. So this breakout usually gives a good return quickly if a trader catches a good breakout.
A trader can follow this type of pattern repeatedly, buying a breakout stock after retesting support and selling at a high price when the stock starts to show exhaustion.
When should a trader exit from stock after a Breakout?
A trader should always have a calculated price target in mind where she wants to book profit, and she should also have a calculated stop loss in place in case a breakout fails.
When the target is achieved, she should book profit and exit.
When a stock fails to hold above the previous resistance trader should have a stop-loss order in place.
Types of breakout
Many breakouts traders can benefit from this, but before buying or shorting a stock, traders should find a good candidate.
Many online screeners available on the internet can help to find good breakout stocks, for example, 2-year scans or 5-year breakout scans, or longer time horizons like monthly breakouts.
One of the best ways to profit from these breakouts is to be aware of the type of breakout you are seeing at any given moment.
Traders should keep in mind to only enter the stock after it successfully retests the previous support or resistance level, which increases the probability of profit.
The longer a stock takes to break out, the chances are it gives a bigger move on the upside or downside, depending on whether you are going short or long.
There are also intraday breakouts, which can also be found with the help of many online screeners. However, the shorter the time frame of the breakout trader can expect more volatility in its price as more people immediately jump into the stock.
Cup and handle pattern
The Cup and Handle pattern is one of the most important chart patterns for making money in the stock market.
The handle normally pulls back from the preceding point to roughly 1/3 of the cup's vertical height; the cup typically resembles U-shape. The Cup and Handle pattern can be considered a bullish continuation and reversal pattern.
A reversal pattern develops when there is a long-term downward trend in the price. The pattern is subsequently reversed, and the price increases as it forms a cup and handle.
If there is a previous uptrend, a continuation pattern will form, followed by a consolidation in the form of a cup and handle pattern to resume the uptrend after the BO.
A cup and handle pattern is a bullish continuation pattern. William O’Neil first introduced it in his book “How to make money in stocks.” As its name implies, this pattern looks like a cup on the left-hand side of the chart and a handle on the right-hand side.
Before the chart breaks out, it takes the shape of the cup and handle, which also looks like a half-circle. On the right-hand side, volatility compression happens where usually trading volume drops before increasing and giving a breakout.
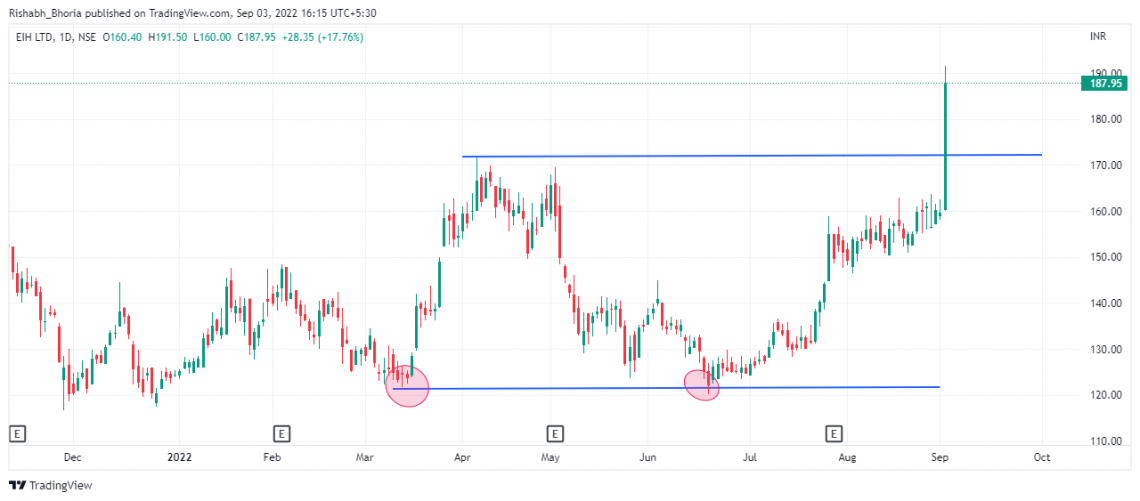
Double bottom
The double bottom is a bullish reversal pattern. Before breaking out from its neckline, the stock price tests its support twice, which are almost equal lows. This chart pattern indicates a reversal in the trend. It resembles a W pattern at the bottom.
Generally, the longer it takes for a stock to make a double bottom, the bigger the breakout it gives and with more certainty of sustaining above a breakout. In a double-bottom pattern, traders should keep the stop-loss just below the support level.
Double-top
The double-top pattern is one of the traders' most common technical patterns worldwide. This is one of my favorite ways to identify potential tops. This price action pattern involves the formation of two highs at key resistance levels.
A double-top reversal is a bearish pattern commonly seen on bar, line, and candlestick charts. As the name suggests, the pattern consists of two consecutive equal peaks, with moderate lows in between.
The idea that the market has been rejected twice from this level indicates that this level is likely to hold. This may sound simple, but for this topping pattern to be effective, a few important things are required.
A double top is a bearish pattern. It is formed after an uptrend and resembles the M sign. Traders can look for shorting opportunities once con traders use a double top pattern, but traders should keep in mind to only enter once support or neckline is broken.
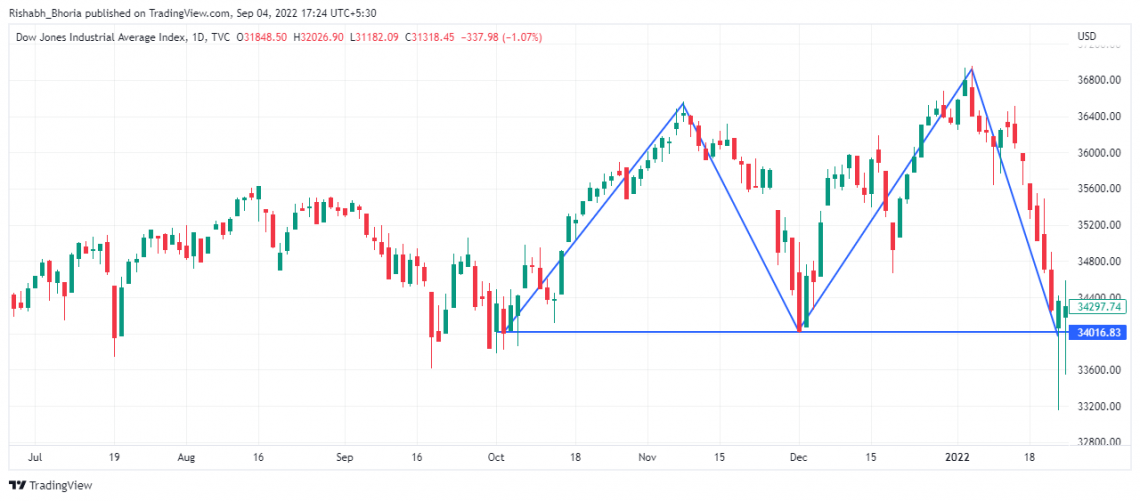
In this pattern, the stock price falls from the resistance level but then retraces back to the top, and it does the same one last time before falling again and breaking the support level.
In the double-top pattern, traders should keep the stop loss above the resistance level.
Ascending Triangle
You can find this pattern in an uptrend, a bullish continuation pattern. An ascending triangle indicates accumulation before the breakout.
To recognize this pattern, you need to see that a stock has made two or more equal highs and has made an upward slanting high from the left-hand side towards the right-hand side of the chart, as shown in the below chart.
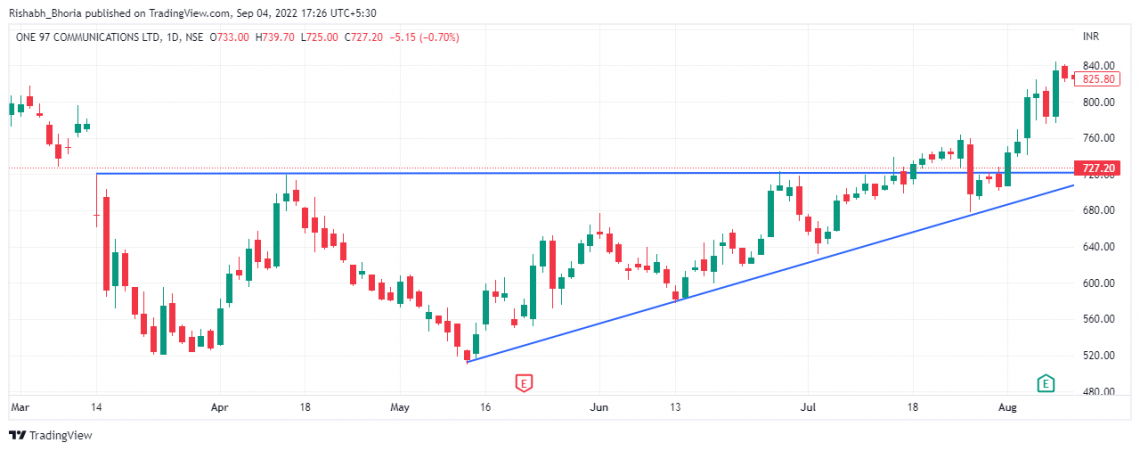
In this pattern, volume usually contracts before expanding and giving a breakout.
Like in other chart patterns in ascending triangles, the bigger the time frame of consolidation before the breakout, the bigger the move a stock gives. Ensure the stock has made at least two higher lows before breaking out.
A stock trader should have a stop loss and a calculated target price to exit.
For example, a trader can put a stop loss just below a slanting support line and can book profits by calculating the thickness of the chart from the left-hand side and adding that to the breakout point.
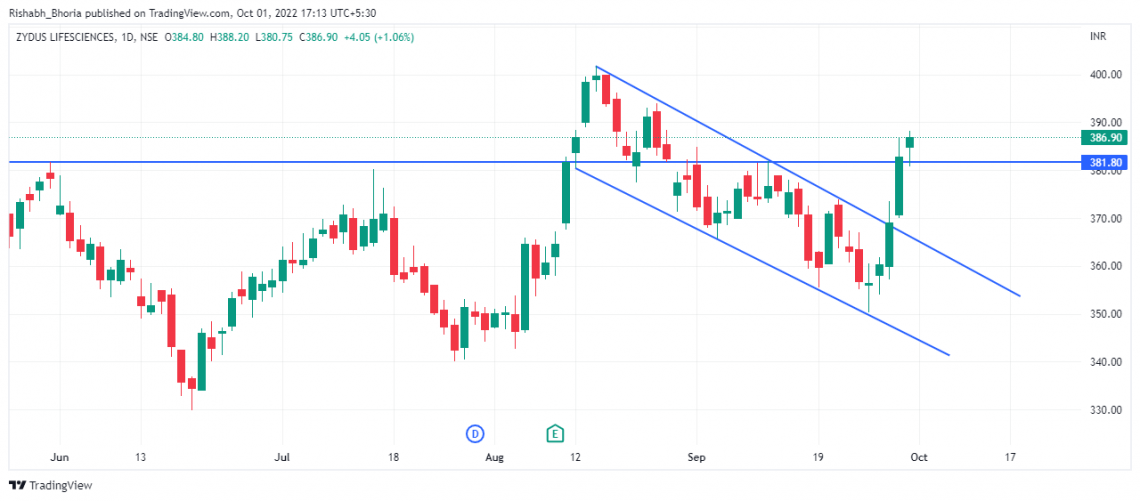
Descending Triangle
It is a bearish continuation pattern. You can find this type of chart pattern in a downtrend.
Before entering this chart pattern, traders should confirm by looking at the chart that it has made consecutive lower lows at least two times, and the chart is making lower slanting lows from the left-hand side towards the right-hand side, as shown in the chart below.
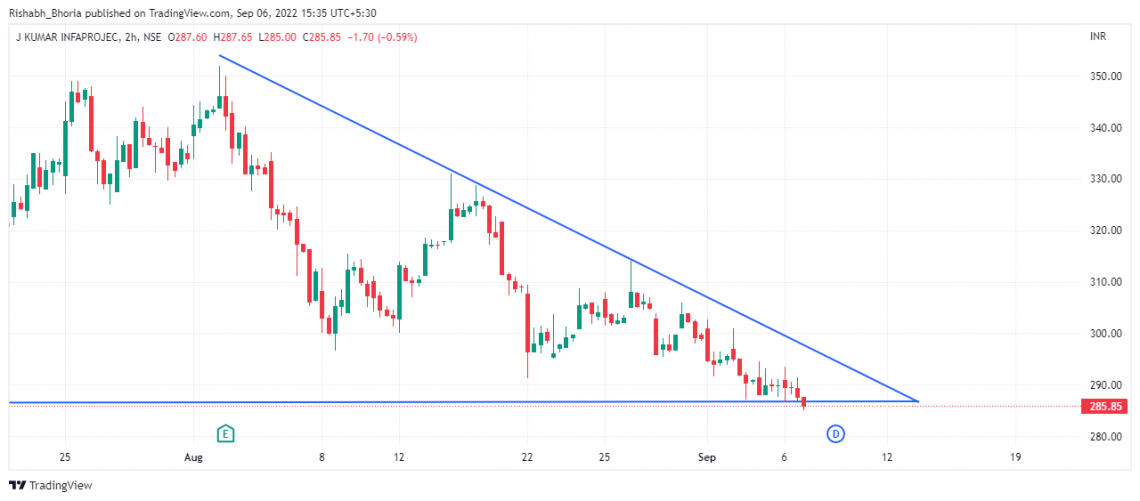
Before the breakdown, the opposite of a breakout, the volume starts to contract before expanding and giving a breakout. Therefore, traders should only enter once the stock has retested its resistance which was previous support.
Traders can short the stock once the stock breaks below a support line, and traders should keep a stop loss just above the resistance line and can book a profit by calculating the triangle's height on the left-hand side and adding it below the support level.
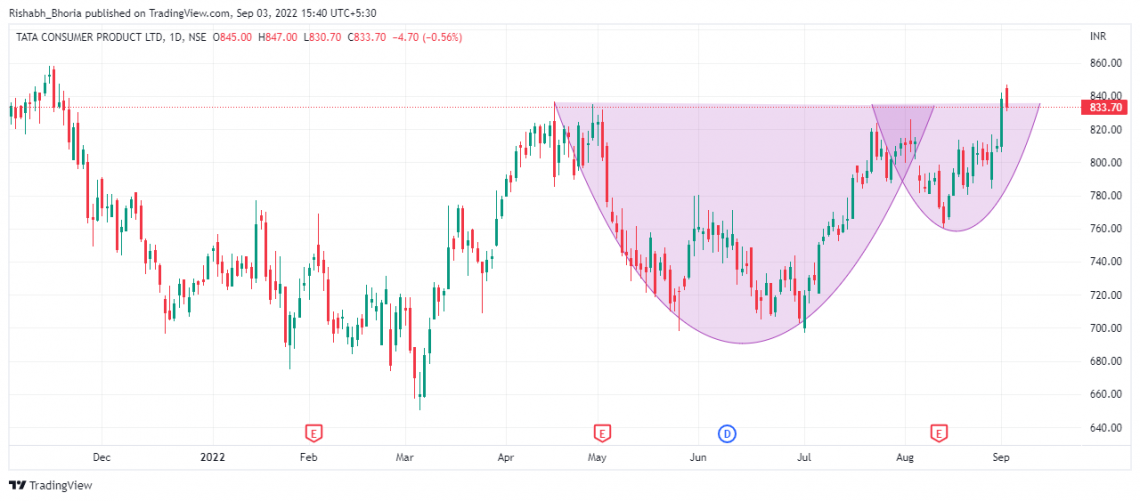
Rounding Bottom
The rounding bottom is a bullish chart pattern. As its name suggests, it takes the shape of a circle from the bottom and rises all the way up towards the completion of the half circle, as shown in the chart below. Its time frame can be from 15 minutes to as long as months.
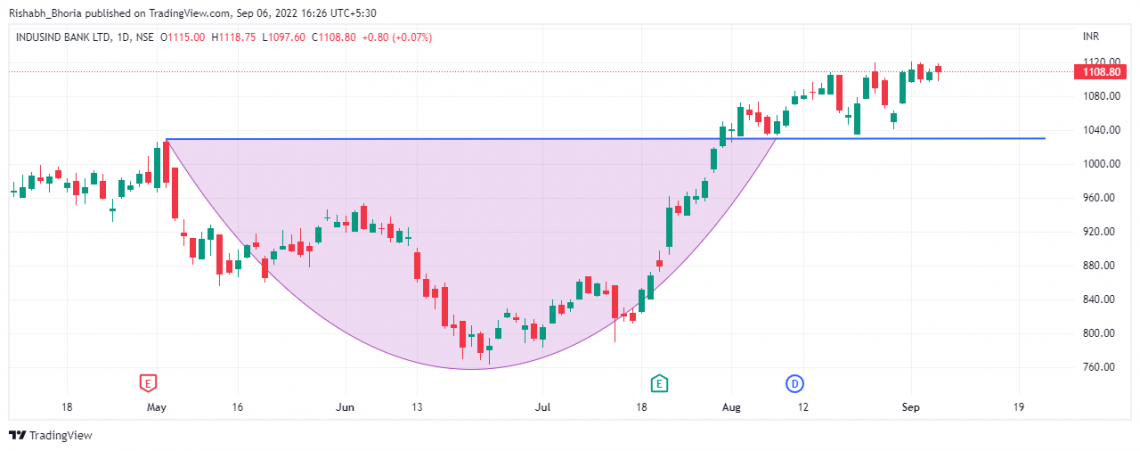
Before stocks make the bottom, the stock usually witnesses continuous supply, due to which price falls heavily. However, when stock is making bottom volume, supply is also the lowest before volume increases with the rising stock price.
Usually, round-bottom stocks are hard to spot, and it can take weeks to complete the round bottom before giving a breakout.
However, once the stock breaks out, it can give a very good return on your investment by continuing to rally upwards in a short amount of time.
To exit, traders should keep stop loss just below the neckline, like many other patterns, and book the profit. Traders should calculate the length from the neckline to the bottom of the pattern and then add that length above the neckline to set the price target.
Head and Shoulder
Head and Shoulder are one of the technical analysis's most widely used patterns. Traders consider it one of the most calculable breakout patterns. The Head and Shoulder pattern is bearish and vice-versa, whereas the inverted Head and Shoulder are bullish breakout.
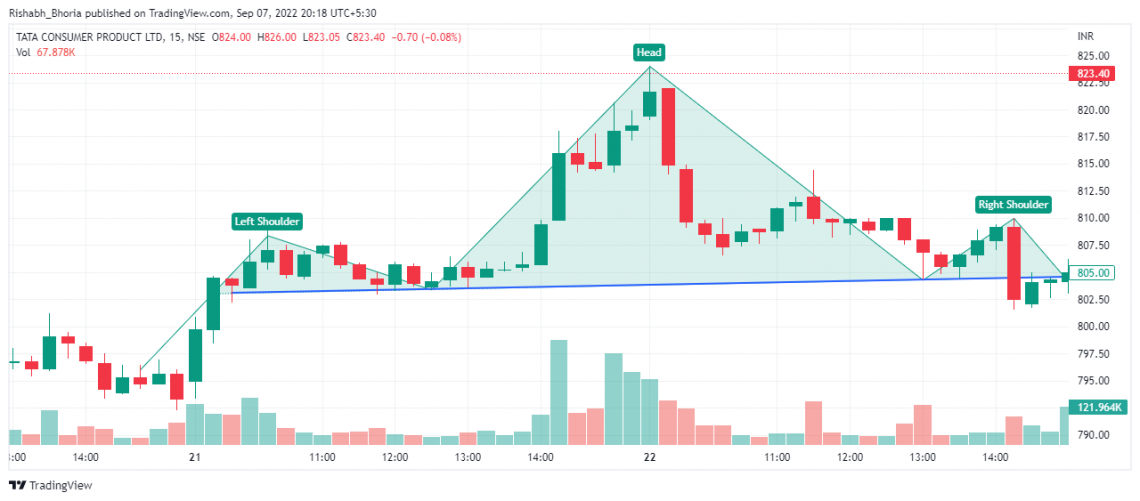
This is often referred to as a reversed head and shoulders pattern in a downtrend or simply a head and shoulders stock pattern in an uptrend. In theory, we expect the momentum to fade in either direction as the stock cannot make new highs or lows.
This pattern occurs in all time frames, whether a 15-minute or monthly chart. Here we are talking about the Head and Shoulder pattern.
Before entering the trade, traders must ensure that the chart has made three highs, with the middle being the highest.
At the same time, the left shoulder is followed by another high, and the right shoulder is followed by a lower high and continues the price decline, as shown in the chart below.
To enter this trade, traders can short the stock below the support line since it is a bearish pattern and can set up a price target by calculating the length between the head and low point of either shoulder, subtracting that from the support line for the price target.
To exit, traders can set a stop loss at the low point of the right shoulder.
Inverse Head and Shoulder Pattern
This pattern is bullish and a very reliable chart pattern. However, it is also considered a reversal pattern. To identify this pattern, traders need to ensure that the chart has made three lows while the middle one is the lowest, and the left and the right shoulder should have closed higher than the middle low.
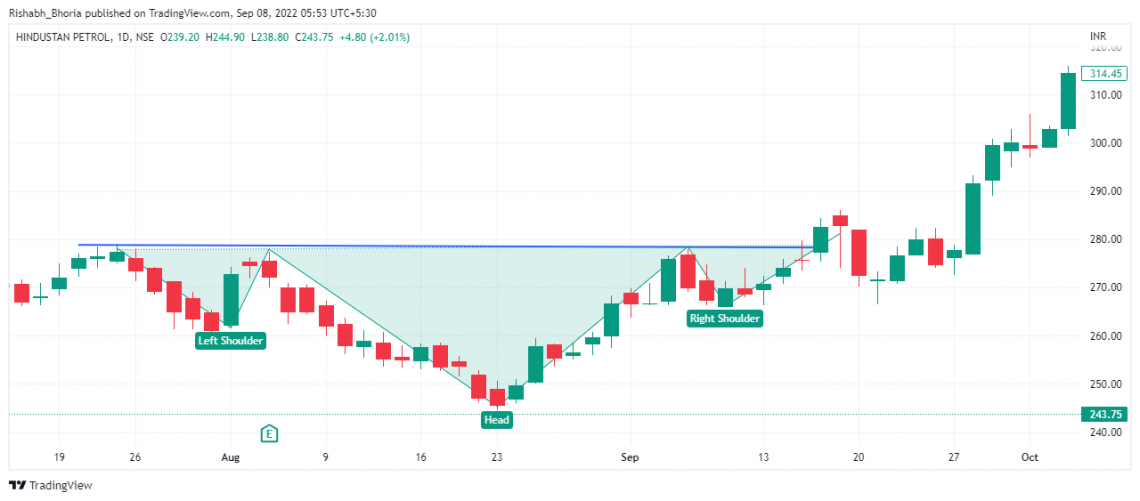
The first low point witnesses a selling, followed by a recovery to the price from where it fell. Thus, making a resistance line. However, it faces heavy selling again, falls to a new low, and starts to swing high and test the resistance. Then, it reverts a little before breaking this resistance, also called a neckline, and begins to rally higher.
A trader can calculate the target price by measuring the distance between the resistance line and the low point of the head and adding it above the resistance line to set a target price and put a stop-loss that can be placed just below the right shoulder.


or Want to Sign up with your social account?