On-Balance Volume Indicator (OBV)
Technical analysis tool that measures buying and selling pressure using volume and price movement


What Is On-Balance Volume (OBV)?
On Balance Volume (OBV) is a technical analysis indicator that measures buying and selling pressure in a financial market.
The indicator was developed by Joseph Granville in the 1960s. Granville created OBV to predict when significant changes in the markets would occur, based on changes in volume, as he believed that volume was the driving force behind markets.
The On Balance Volume Indicator calculates the cumulative total volume by adding positive values when the price closes higher than the previous day's closing price, and deducting negative values when the price closes lower.
The OBV line is then plotted on a chart and can be used by traders to identify potential trend reversals and confirm price trends.
The OBV line is considered a leading indicator, meaning it can provide information on future price movements.
When the OBV line rises, it suggests that buying pressure is increasing, and the price will likely continue to rise. Conversely, when the OBV line is falling, it suggests that selling pressure is increasing, and the price is likely to continue to fall.
It's crucial to remember that no indication can precisely forecast how the market will act. Traders should use the OBV in combination with other technical indicators and analysis techniques and should always practice risk management strategies when trading.
- OBV measures buying and selling pressure using volume changes and price movements over time.
- Rising OBV signals increased buying pressure; falling OBV signals increased selling pressure.
- Divergences between OBV and price may signal potential trend reversals.
- OBV can confirm trends when directionally aligned with price.
- Advantages include easy calculation and versatility across markets, but limitations exist around false signals and sensitivity.
How to Calculate On Balance Volume?
On Balance Volume gives a running total of the trading volumes in an asset and shows whether this volume is coming into or leaving a certain asset. The OBV is the sum of all volumes (positive and negative).
To calculate On Balance Volume (OBV), follow these steps:
1. Start by setting an initial OBV value. This can be any value you choose, but it is usually set at zero.
2. Compare the closing price of a trading session with the closing price in the preceding session. Use the following instructions going further:
- If the closing price in the current session is higher than the closing price of the preceding session, add the volume of the current session to the On Balance Volume of the preceding session.
- If the closing price in the current session is lower than the closing price of the preceding session, subtract the volume of the current session from the On-Balance Volume of the preceding session.
- If the closing price in the current session is equal to the closing price of the preceding session, the OBV value remains changed.
3. Plot the resulting values on a chart to create the OBV line. For example, let's say that the closing price for Day 1 was $10, and the volume was 100 shares. The OBV value for Day 1 would be 0 since there is no previous period to compare it to. On Day 2, the closing price was $12, and the volume was 150 shares.
Since the closing price is higher than that of the previous day, you would add 150 to the previous day's OBV value of 0, resulting in an OBV value of 150 for Day 2.
You would continue to repeat this process for each trading period, adjusting the OBV value based on whether the price closed higher or lower than the previous period's closing price.
How to use the On Balance Volume Indicator?
The On Balance Volume (OBV) indicator tells traders the cumulative volume of buying and selling pressure for a given asset over time.
The OBV can provide traders with several pieces of information:
1. Trend Confirmation
If the OBV is rising, it suggests that buying pressure is increasing, and the price will likely continue to rise.
Conversely, if the OBV is falling, it suggests that selling pressure is increasing, and the price is likely to continue to fall.
The OBV can help confirm price trends and provide insight into the trend's strength.
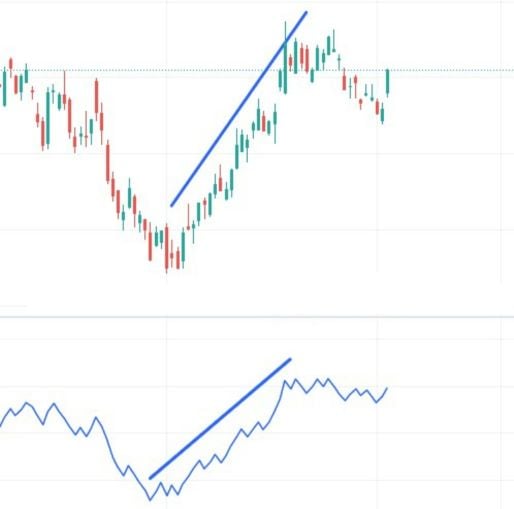
In the image given above, the chart shows price movement with the help of candlesticks, while the second graph represents the OBV line. As you can see, as the OBV line rises, the price of the underlying moves up as well.
2. Trend Reversal
When the OBV starts to diverge from the price trend, it can signal a potential trend reversal.
For instance, when the price of an underlying asset rises but the OBV declines, one can infer that the purchasing pressure has begun to subside and that the price may soon begin to decrease.
3. Bullish And Bearish Divergences
The OBV can also be used to identify bullish and bearish divergences.
A bullish divergence occurs when the price is trending downward, but the OBV is trending upward, indicating that buying pressure is starting to increase.
A bearish divergence occurs when the price is trending upward, but the OBV is trending downward, indicating that selling pressure is increasing.
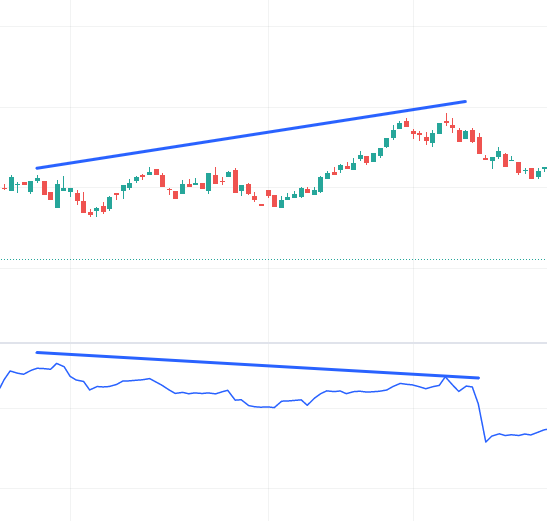
In the image above, we can see that while the stock price moves upwards, the OBV line is in a downward trajectory. Later, we see the price of the underlying dips. This is an example of a bearish divergence.
Overall, the OBV may assist traders in confirming trends, seeing probable reversals, and spotting bullish and bearish divergences. It can also give traders useful information on buying and selling pressure.
Advantages of using On Balance Volume Indicator
There are several advantages to using the On Balance Volume (OBV) indicator in a technical analysis:
1. OBV Can Help Identify Potential Trend Reversals
The OBV line is considered to be a leading indicator, meaning it can provide information on future price movements. When the OBV line diverges from the price trend, it can signal a potential trend reversal.
2. OBV Can Help Confirm Price Trends
When the OBV line is rising, it suggests that buying pressure is increasing, and the price will likely continue to rise.
Conversely, when the OBV line is falling, it suggests that selling pressure is increasing, and the price will likely continue to fall. This can help confirm other technical indicators and analysis techniques.
3. OBV Can Be Used In Conjunction With Other Indicators
Traders can use OBV along with other technical indicators, such as trend lines or moving averages, to identify potential buy or sell signals. Additionally, traders may use the OBV to confirm other technical indicators, such as the Relative Strength Index (RSI).
4. OBV Is Easy To Calculate And Interpret
Calculating OBV is a simple process that only requires a few steps, and the resulting line can be easily plotted on a chart. Additionally, the OBV line is easily interpreted, with rising and falling values clearly indicating buying and selling pressure.
5. OBV Can Be Used For Any Financial Market
The OBV indicator can be used for any financial market, including stocks, forex, and commodities. This makes it a versatile tool for traders who trade across multiple markets.
Disadvantages of using On Balance Volume Indicator
While the On Balance Volume (OBV) indicator has several advantages, there are also some potential disadvantages to using it in technical analysis:
1. OBV Can Provide False Signals
Like any technical indicator, the OBV can provide false signals, leading to losses if traders act on them. It is important to use the OBV in combination with other indicators and analysis techniques to reduce the risk of false signals.
2. OBV Does Not Account For Fundamental Factors
The OBV is a purely technical indicator and does not consider fundamental factors that can impact a market, such as economic news or geopolitical events.
3. OBV Can Be Sensitive To Price Fluctuations
The OBV is sensitive to price fluctuations, which can lead to a high number of signals that may be difficult to interpret.
Traders should use the OBV in conjunction with other indicators and analysis techniques to filter out false signals and reduce the risk of making poor trading decisions.
4. OBV May Not Be Suitable For All Trading Styles
The OBV may be more suitable for swing and position traders, as it provides a longer-term perspective on market trends. Day traders, who typically make trades based on short-term price movements, may find the OBV less useful.
5. OBV Does Not Work Well In All Market Conditions
Some market situations, such as those with little liquidity or significant volatility, may make the OBV less effective.
Traders should be aware of these limitations and use the OBV in combination with other indicators and analysis techniques that are better suited to the market conditions they are trading.


or Want to Sign up with your social account?