Put-Call Ratio (PCR)
An indicator used to get an idea of the overall sentiment of investors


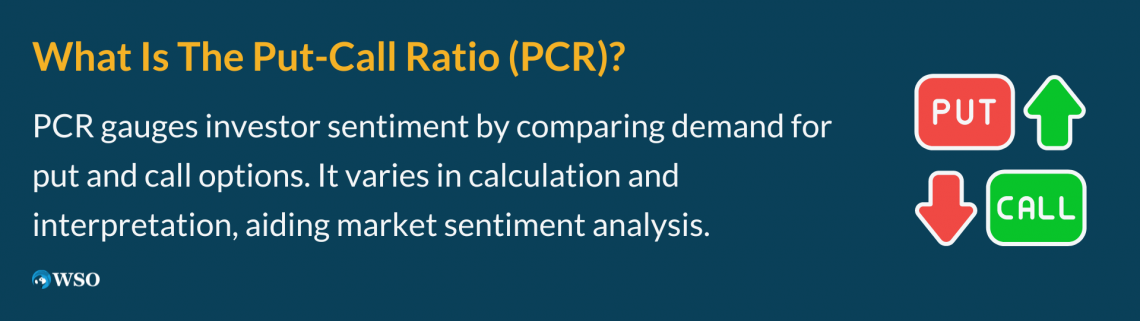
What Is the Put-Call Ratio (PCR)?
The put-call ratio (PCR) is an indicator used to get an idea of the overall sentiment of investors. The ratio can be calculated for any given stock or index on any given day. The ratio compares the demand for the two classes of options contracts, puts, and calls.
It is straightforward; however, the calculations can vary quite a bit. It is standard for the PCR to be calculated on a given day, but it can be calculated based on open interest or trading volume.
Furthermore, investors looking to develop a more holistic picture of the market can calculate changes in the put-call ratio and average PCR over a certain period. These indicators can be used in various ways, depending on investor preference.
In addition to the flexibility in ratio calculation, investors interpret the ratio value differently. As well as being an overall indicator of market sentiment, contrarian investors may look at the ratio and decide to make the opposite trade to market sentiment.
- The PCR is an indicator used to gauge investor sentiment by comparing the demand for put options (which bet on a stock's decline) to call options (which bet on a stock's rise) for a particular stock or index on a given day.
- Investors can assess changes in PCR and average PCR over a specific period to gain a more comprehensive understanding of market sentiment, aiding decision-making.
- The interpretation of PCR values varies among investors. While some view it as an overall indicator of market sentiment, contrarian investors may use it to identify potential opportunities by trading against prevailing sentiment.
Example of the Put-Call Ratio
At the most basic level, calculating this ratio is extremely simple. For example, the put call ratio is the number of put options traded divided by the number of call options traded.
Briefly, what are put options and call options? Options contracts are securities that derive value from the underlying asset they give the holder leverage over. An option contract allows the owner to buy or sell 100 shares of the underlying common stock at a set price and time.
For put options, the contract holder has the right to sell 100 shares of the underlying at a specific price (called the strike price) until the contract expires.
The thinking is that the stock will have a market price below the strike price at expiration. So the put option owner would buy shares on the market and then use their option to sell those shares at the strike price, making money on the difference between prices.
For call options, the contract holder has the right to buy 100 shares of the underlying stock at the strike price up until expiration.
The call option contract holder expects the market price to rise above the strike, meaning that the contract owner can sell the stock at market price after purchasing at the strike, making money on the price difference.
As mentioned before, the put-call ratio is the number of put contracts traded divided by the number of call options traded.
Puts Contracts Traded / Call Contracts Traded
It can be expressed both in terms of trade volume and open interest.
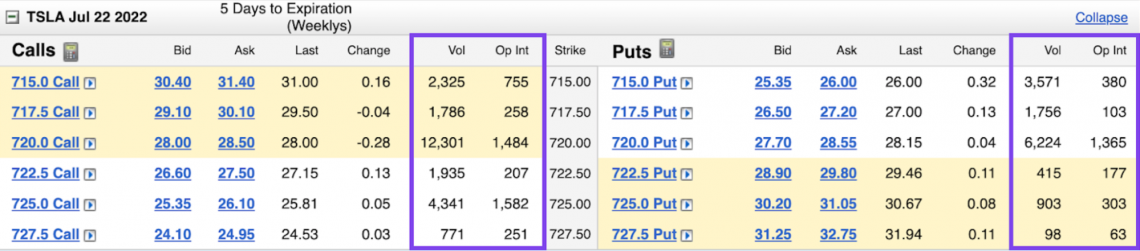
Put Contract Trade Volume / Call Contract Trade Volume
Put Contract Open Interest / Call Contract Open Interest
What is the difference between trade volume and open interest? Open interest reflects the number of contracts held by investors during a given day, while volume refers to the number of trades of those contracts during a given day.
For example, if there were 100 contracts held, that would mean that the open interest on that day was 100. If each of those contracts were traded twice, the trading volume would be 200.
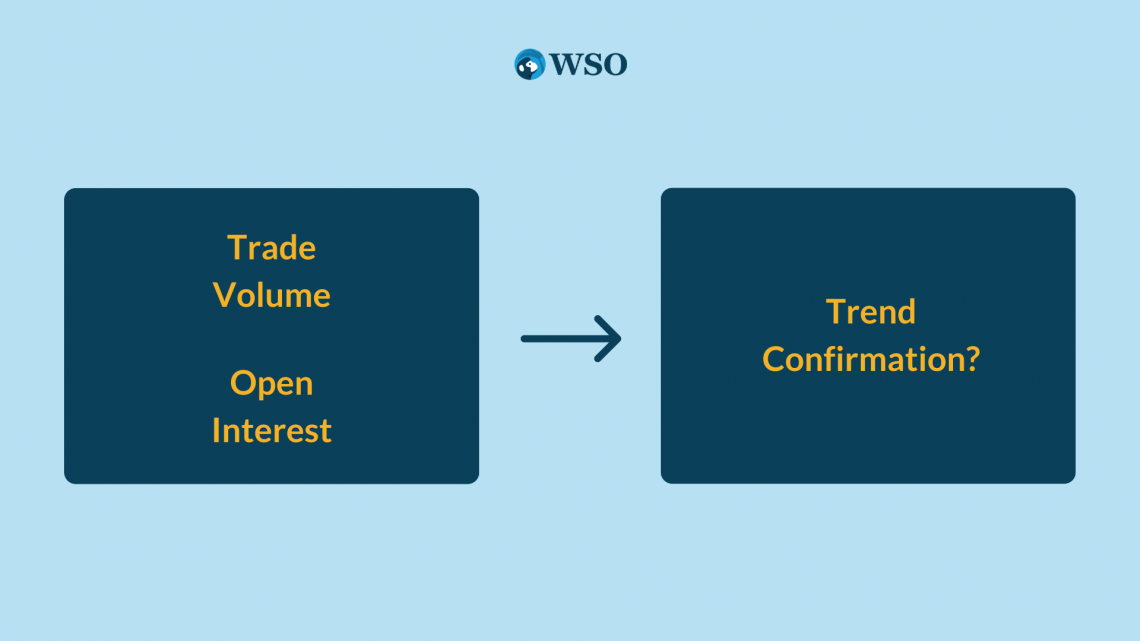
Investors look at trade volume to determine whether there is much interest in a specific contract. It also gauges liquidity, which is how easy it is to enter and exit a position.
Trade volume can be used as an indicator of price strength, specifically its movement.
Investors look at open interest to see how many traders are in the market. It Increases in genuine interest signal more investors joining the specific option contract market, while a decrease in open interest signals investors leaving the market.
An increase or decrease in open interest can be used as a signal to confirm a market trend, much like trade volume.
Although it is usually calculated as a daily ratio, there is no reason investors could not calculate the weekly put-call ratio or determine changes in the PCR daily. The formula’s essence would be the same; the only differences would be the values inputted.

How to Interpret the Put-Call Ratio
Once calculated, the ratio is used as an indicator of market sentiment around given security. We can see why by understanding the demand for put option contracts and call option contracts.
Because put option contracts are demanded when investors have a bearish outlook, and call option contracts are demanded when investors have a bullish outlook, the ratio between the two can describe the overall sentiment of investors.
Logically, a higher put-call ratio would mean increased demand for puts compared to calls. Likewise, a lower ratio value would mean that the need for calls outweighs the demand for puts.
Therefore, a higher ratio would signal a bearish sentiment. On the other hand, a lower ratio would signal a bullish sentiment. So what exactly is considered a “high” or “low” PCR?
From a mathematical standpoint, a ratio of 1 would mean that the demand for puts and calls is the same. However, in reality, investors do not view a ratio of 1 as a possible point of comparison for whether the ratio is high or low.
Because the general market sentiment sees more investors purchasing call options than put options, it aligns with the view that the stock market tends to increase over time.
Instead of using a PCR of 1, 0.7 is referred to as the baseline for measuring sentiment, meaning that 0.7 is considered the average ratio of put contracts traded to call contracts traded.
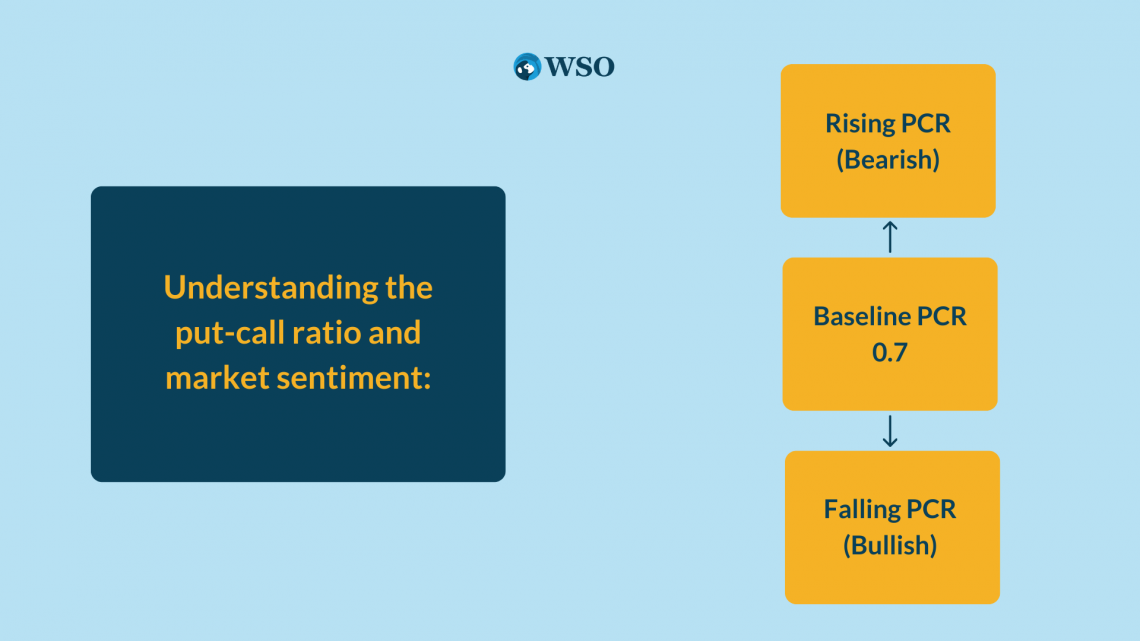
A ratio above 0.7 is considered a rising put-call ratio meaning that the relative quantity of puts being purchased is more significant than calls. However, it does not necessarily mean that more puts are being purchased than calls; that is only true when the ratio exceeds 1.
Nonetheless, even if the ratio falls between 0.7 and 1, it is still considered a bearish sentiment signal. It is because although more calls are being purchased than puts, the amount of puts purchased concerning calls is greater than usual.
A ratio below 0.7 is known as a falling put-call ratio indicating that more calls are being purchased (when compared to puts) than average. This signals a bullish sentiment.
PCR as a Contrarian Indicator
In addition to indicating market sentiment, some investors use the put-call ratio as a contrarian indicator that signals either a market top or bottom.
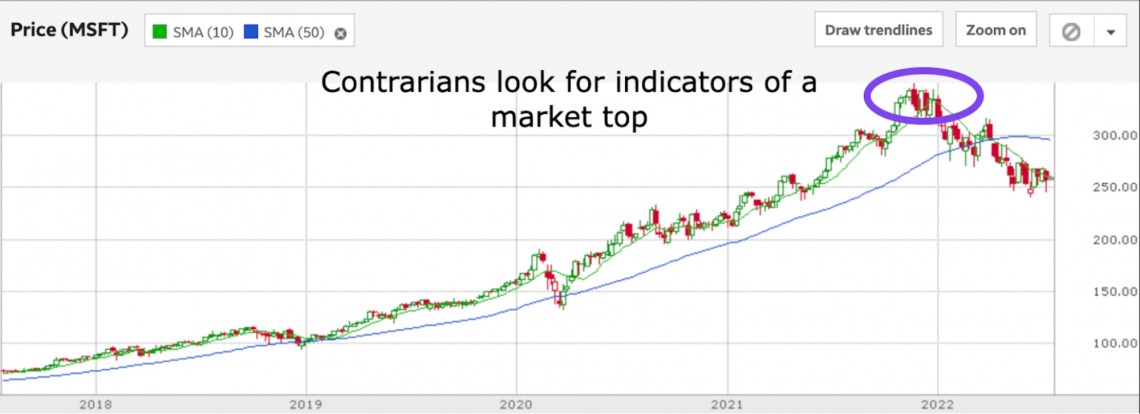
Interestingly, for these investors, an extreme ratio value signals a position opposite of the general market sentiment, hence the “contrarian view.”
These investors think that if the market is overly bullish or bearish, equities could be overvalued or undervalued.
For example, a put-call ratio of 1.3 would be a significantly bearish signal. The overall feeling is that the market is going to go down. For a contrarian, this ratio could show that the market is too bearish.
Expecting a bottom and a turnaround soon, a contrarian investor may think it is time to start buying.
A meager ratio, say, 0.4, means that the number of calls traded far outweighs the number of puts. This would be considered an extremely bullish sentiment signal.
Contrarians, who would see this indicator as a sign of the market being overly optimistic, might think that the market is reaching its top. So instead of buying in like the rest of the market, they might opt to take profits and look to catch the next buying opportunity.
It is important to note that there is no specific point that is set in stone defining whether or not a put-call ratio value is extreme or not. Instead, investors compare to determine whether the current PCR is intense enough to signal a decision.
Put-Call Ratio in Decision-Making
For investors using the put-call ratio as an indicator to help determine investment decisions, it is crucial to consider how the ratio moves.
As described earlier, it can be calculated using trade volume or open interest. Depending on the method used, the actual value of the ratio can be quite different from day to day.
Individuals looking at the PCR should pay attention, not just to these changes, but to what drives them.
For example, let's say the PCR shifts up, signaling a bearish sentiment. However, an investor looking at this change also notices that the put trade volume has not changed, but the call volume has decreased today.
The lower call volume in the denominator is driving the increase in the PCR, not an increase in demand for puts. In addition, open interest remained the same for both calls and puts.
In this situation, investors interested in call options are not closing their positions. Instead, they may wait to purchase more call options or close their current positions.
As we can see, using the indicator is more complicated than just making a decision based on a number alone. Therefore, investors should be careful when interpreting the PCR, taking into account precisely what changes have occurred to drive differences in the ratio.
In summary, decision-making using the PCR can be thought of as a few steps:
- Calculate the PCR
- Determine reasons for change
- Make an investment decision
Conclusion
The put-call ratio is an indicator that can be used in various ways to determine an investment strategy. At its heart, the ratio judges the market's overall sentiment by comparing put option interest to call option interest.
In terms of calculation, on a given day, it can be determined by trading volume or open interest. Once a measure is chosen, the calculation method is always the same. The put measurement is the numerator, and the call measurement is the denominator.
Beyond just simple calculations, investors can look at changes in the put-call ratio and ratio average over time.
Developing a more deliberate investment strategy involves both noticing the changes and understanding what underlying changes in the market have led to the PCR value at that time.
From the contrarian point of view, PCR values that are outside the normal range and demonstrate sharp change can signal extreme market conditions. It may influence a decision that is contrary to the overall market sentiment.
Investors interested in using indicators such as the PCR should also understand fundamental analysis and how it drives company valuation.

Free Resources
To continue learning and advancing your career, check out these additional helpful WSO resources:


or Want to Sign up with your social account?