Trading Channel
A technical analysis tool that can illustrate trends in stock prices.
 Yang")

What Is A Trading Channel?
A trading channel is formed by two parallel lines, representing the price range where a security or market typically trades between over time, based on resistance and support levels. It's like a corridor that contains the price movements and shows the direction and strength of the trend.
This channel can be horizontal, ascending, or descending. This depends on whether the price is moving sideways, upwards, or downwards. The upper and lower boundaries of the channel are called resistance and support levels, respectively.
Resistance is where the price meets selling pressure and tends to bounce back down. Support is where the price meets buying pressure and tends to bounce back up.
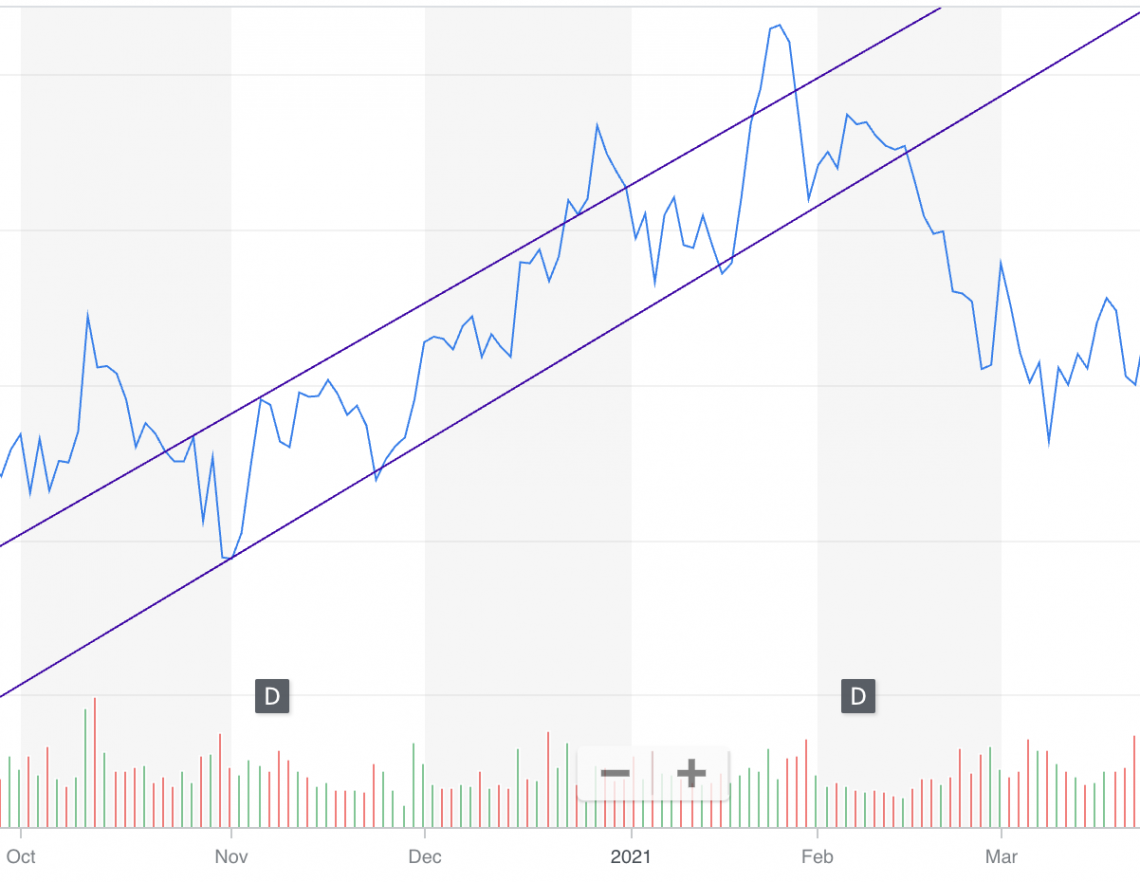
Here's an example of an ascending channel on the daily chart of Apple. The peaks and valleys inside the channel follow an ascending pattern since October 2020. The purple lines outline the channel.
A trading channel can help traders identify trade entry and exit points and potential breakouts or reversals. For example, if the price is trading near the lower boundary of an ascending channel, it may be a good time to buy.
In the theory of trading channels, the price is likely to stay within the two bounds. If the price is low, it will likely rise toward the upper bound. Meanwhile, it may be profitable to sell while the price is high. This is because the price will trend towards the lower bound then.
However, traders should also be aware of the risks of these channels. Sometimes, the price may break out of the channel and start a new trend in the opposite direction. Major shifts in investor sentiment can cause these occurrences.
It can also occur when a major news event affects market sentiment. Therefore, traders should always use stop-loss orders and other risk management tools to protect their positions.
- A trading channel is a chart pattern formed by drawing two parallel lines around the price movements of an asset, typically indicating consistent support and resistance levels over a certain period.
- There are three main types of trading channels: ascending (upward trend), descending (downward trend), and horizontal (sideways trend), each reflecting different market conditions.
- Traders use trading channels to identify potential buy and sell points, as prices tend to bounce between the support and resistance lines, offering opportunities for profitable trades.
- Channels are formed by connecting the high points (resistance) and low points (support) on a price chart, which helps traders visualize the range within which an asset’s price fluctuates.
Understanding Trading Channel
Trading channels are useful tools for identifying potential buying and selling points. The basic idea is to buy near the lower trend line and sell near the upper trend line.
The opposite can also be applied, depending on the direction of the channel. However, other strategies can be applied, such as:
- Breakout trading
- Reversal trading
- Channel surfing
Breakout trading involves waiting for the price to break out of the channel, either above or below, and following the direction of the breakout. This signals a possible change in the trend and a new momentum in the market.
Reversal trading involves anticipating a reversal in the price direction at the channel boundaries and taking a counter-trend position. This is based on the assumption that the price will bounce back from the trend lines and resume its previous movement within the channel.
Reversal traders should use tight stop-losses and be aware of false signals and fakeouts.
Channel surfing involves trading within the channel by using smaller time frames and shorter-term indicators. This allows traders to capture smaller price movements and fluctuations within the channel.
NOTE
Breakout traders should look for confirmation from other indicators, such as volume, candlestick patterns, and oscillators, before entering a trade.
Channel surfers should be flexible and adaptable to changing market conditions and adjust their positions accordingly.
As you can see, trading channels are versatile and powerful tools that can help you improve your trading performance and profitability. They can help you identify trends, ranges, breakouts, reversals, and opportunities in any market and time frame.
However, they are not foolproof. You should always verify the results of the trading channels with other tools. Check out our other resources about fundamental analysis and technical analysis.
Types Of Trading Channels
These channels are useful tools for traders who want to identify trends, entry and exit points, and risk levels.
1. Ascending
These channels are formed when an asset's price is higher within two parallel lines that slope upward. The upper line connects the swing highs and acts as resistance, while the lower line connects the swing lows and acts as support.
Traders can buy when the price touches the lower line and sell when it touches the upper line, or they can trade breakouts when the price closes above or below the channel.
2. Descending
These channels are the opposite of ascending channels. They are formed when the price of an asset is moving lower within two parallel lines that slope downward.
The upper line connects the swing highs and acts as resistance, while the lower line connects the swing lows and acts as support.
NOTE
Traders can sell when the price touches the upper line and buy when it touches the lower line, or they can trade breakouts when the price closes above or below the channel.
3. Horizontal
These channels are also known as trading ranges or rectangles. They are formed when the price of an asset is moving sideways within two horizontal lines.
The upper line connects the swing highs and acts as resistance, while the lower line connects the swing lows and acts as support.
NOTE
Traders can buy low and sell high within the channel or trade breakouts when the price closes above or below the channel.
4. Enveloping
These channels are not parallel lines but rather bands that surround the price of an asset. They are usually based on some indicators, such as moving averages, Bollinger bands, Keltner channels, or Donchian channels.
The upper band acts as resistance, while the lower band acts as support. Traders can use enveloping channels to measure volatility, trend strength, overbought and oversold conditions, and potential reversals.
Using A Trading Channel
A trading channel is a graphical representation of the price movement of an asset within two parallel lines. The upper line is called resistance. Meanwhile, the lower line is called the support.
The idea is that the price tends to bounce between these two lines until it breaks out in either direction.
The channel can help you determine entry and exit points for your trades. Here are some of the benefits of using this channel:
1. Helps to identify the trend
If the price is moving within an upward-sloping channel, it means that the asset is in an uptrend. But if the price is moving within a downward-sloping channel, it means that the asset is in a downtrend.
NOTE
The asset is in a range-bound market if the price moves within a horizontal channel.
2. Helps to measure the volatility
The width of the channel indicates how much the price fluctuates within the trend. A wider channel means that the price is more volatile. In contrast, a narrower channel means that the price is more stable.
3. Helps find trade opportunities
You can use the channel as a guide to buy low and sell high. You can buy when the price touches or approaches the support line and sell when the price touches or approaches the resistance line.
NOTE
You can also look for breakouts or breakdowns of the channel, which signal a possible reversal or continuation of the trend.
You need to identify and connect the swing highs and lows to draw this channel. A swing high is a peak in the price movement. Meanwhile, a swing low is a trough in the price movement.
You can use any time frame that suits your trading style. In general, longer time frames tend to be more reliable.
Once you have identified two swing highs and two swing lows, you can connect them with straight lines to form your channel. The upper line should connect the swing highs, and the lower line should connect the swing lows.
Make sure that both lines are parallel to each other and that they contain most of the price action within them.
Example Of A Trading Channel
Here is an example of a horizontal channel on a daily chart of EUR/USD:

As you can see, the price has been moving within this channel since November 2020, making constant highs and lows. The channel has acted as a support and resistance for the price, providing several trading opportunities along the way.
For example, you could have bought when the price bounced off the support line in December 2020 and March 2021 and sold when the price reached or came close to the resistance line in January 2021 and May 2021.
You could have also traded the channel breakdown in August 2021, which signaled a change in trend.
Of course, these channels are imperfect and do not guarantee success. Sometimes, the price may fake out or fail to reach either channel line. Sometimes, the channel may be too wide or too narrow to offer clear signals.
NOTE
The channel may sometimes change its slope or shape.
That's why you should always use other indicators and tools to confirm your analysis and manage your risk. For example, you can use moving averages, trend lines, Fibonacci retracements, oscillators, candlestick patterns, etc., to complement your channel strategy.
For example, the 30-day moving average is a commonly used indicator that can be paired with a trading channel to confirm the price trend. Similarly, the Relative Strength Index can also be used to identify changes in momentum within the stock price.
You should also use stop losses and take profits to protect your capital and lock in your gains. A common way to set your stop loss is to place it below or above the nearest swing low or high outside of the channel.
A common way to set your take profit is to use a risk-reward ratio of at least 2:1 or to target a previous support or resistance level.
These channels are simple yet effective. They can help you spot trends, measure volatility, and find trade opportunities in any market condition.
Advantages Of Trading Channels
Trading channels can be useful for traders who want to capture the market's swings and trade with the trend. They can also help you spot potential breakouts or reversals when the price reaches the channel boundaries.
Here are the advantages of using this channel:
1. Determines the trend direction of the market
A rising channel means that the price is making higher highs and higher lows, indicating an uptrend. A falling channel means the price is making lower and lower highs, indicating a downtrend.
A horizontal channel means the price moves sideways, indicating a range-bound market. By knowing the trend direction, we can align our trades with the dominant market force and avoid trading against the trend.
2. Identifies support and resistance levels within the channel
Support is the lower line of the channel that acts as a floor for the price, preventing it from falling further. Resistance is defined as a ceiling for the price, preventing it from rising further.
NOTE
Support and resistance levels can act as potential entry and exit points for trades.
For example, we can buy near support in an uptrend or sell near resistance in a downtrend. We can also place stop-loss orders below support or above resistance to protect our trades from unexpected reversals.
3. Spots breakout points that signal a change in the trend direction or strength
A breakout occurs when the price breaks out of the channel boundaries, either above resistance or below support. A breakout can indicate that the price has gained enough momentum to continue in the same direction or to reverse in the opposite direction.
A breakout can also provide us with new trading opportunities. For example, we can buy after an upside breakout in an uptrend or sell after a downside breakout in a downtrend. We can also place stop-loss orders below the breakout point to limit our risk.
Disadvantages Of Trading Channels
Trading Channels also have some drawbacks that you should be aware of. Here are some of them:
- Objective to each trader: They are subjective and depend on how you draw them. As a result, their interpretations can vary. Where one trader may identify a trading channel, another trader may see nothing but arbitrary price movements.
- Not always representative of the market: Trading channels may not always reflect the true nature of the market. Sometimes the price may move sideways or in a choppy manner within a channel, making it hard to identify clear signals.
- Performs poorly in volatile markets: Trading channels may not work well in volatile or fast-moving markets, where the price may break out of the channel frequently or unpredictably.
- Not a comprehensive indicator: Trading channels may not account for other factors that affect the price, such as news events, fundamentals, sentiment, etc.
- False breakouts: When applying trading channels, traders may sometimes encounter a false breakout. This happens when the price breaches the support or resistance level but reverses to return to the channel.
NOTE
You can avoid trading a false breakout by waiting for the new trend to be confirmed.
So, as you can see, trading channels are not a perfect tool and have limitations. You should always use them in conjunction with other indicators and methods to confirm your analysis and trading decisions.
And remember, no matter what tool you use, always have a risk management plan and stick to it.
Free Resources
To continue learning and advancing your career, check out these additional helpful WSO resources:


or Want to Sign up with your social account?