Weighted Moving Average (WMA)
It assigns varying weights to the price data of various trading periods.


What Is The Weighted Moving Average (WMA)?
A kind of moving average indicator is known as a weighted moving average indicator. This indicator assigns varying weights to the price data of various trading periods.
The method is based on the principle of giving more weight to more current data and less weight to more ancient data. This demonstrates the prevalent trend rather than the trend that existed before.
Since recent data is given a larger particular weight, this method, in addition to reducing the frequency and magnitude of extreme price fluctuations, also provides a more accurate assessment of the current direction of the trend.
The indicator responds more quickly to shifts in price due to the increased weight it gives to more current price data.
In calculating a Weighted Moving Average, more emphasis is placed on more recent data and less on older data. The cost of each bar is multiplied by a specific value to accomplish this. In addition, WMA is calculated differently than the standard Simple Moving Average, so it tracks prices more closely.
- A moving average is a price indicator that can be applied to stocks and other types of assets.
- Moving average indicators come in various forms, including Exponential Moving Average (EMA), Simple Moving Average (SMA), Weighted Moving Average (WMA), and others.
- One of the most common types of moving average indicators is called the Weighted Moving Average, or WMA for short. The term "weighted" comes from the importance placed on information about more recent periods.
- The WMA formula is arrived at by multiplying daily average Bitcoin prices by a predetermined weight. Prices that are lower carry a lesser weight, while those that are higher carry a greater weight.
- The WMA indicator places more weight on more recent data while disregarding data from earlier periods. If we select 9 periods, it will only analyze data based on the most recent 9 days, ignoring any price action that occurred before that time.
- The WMA indicator moves faster than other indicators, such as the SMA and the EMA. This serves as a leading indicator for the WMA indicator, which helps it to predict future trends before they occur accurately.
- Using the indicator on the daily chart and waiting for the candles to reverse below the WMA line before entering a long trade is a reliable strategy. This strategy is used with the daily chart. On the other hand, when the VMA line is located above the candles, it is possible to open a short trade.
History of Weighted Moving Average
John J. Murphy, a financial analyst in New York, thought up the Weighted Moving Average.
After receiving his liberal arts degree in the late 1960s, Murphy looked for work on Wall Street. In his first position, he assisted the portfolio manager and plotted equities for CIT Financial Corporation.
He started in the commodities department at Merrill Lynch in the early 1970s and eventually became the head of technical analysis there.
Murphy went out on his own for the first time in the 1980s, beginning his career as a consultant and eventually teaching at the New York Institute of Finance at night. As a professor, he penned his first book, Technical Analysis of the Financial Markets.
Moving averages have been used in the stock market for over 100 years. Still, the WMA indicator didn't debut until 1999 when J. Murphy included it in his thesis "Technical Analysis of the Financial Markets" The New York Institute of Finance printed and gave out the academic paper.
Note
Murphy said that the financial markets didn't have a moving average that gave more weight to data from the most recent period. He said it was a bad thing. The moving averages used before gave information that was behind the current situation.
On the other hand, this indicator could predict trends as they were happening in the present. Right now, this is one of the most popular types of moving average indicators.
How does the WMA indicator works?
Determine the direction of the trend with the aid of the WMA. When prices drop to a point close to or slightly below the WMA, this may be a signal to purchase. When prices climb near or slightly above the WMA, it may indicate that sales should be considered.
Moving averages are another useful tool for identifying potential support and resistance regions. Price movement is often supported when the WMA is moving higher, whereas price action is typically met with opposition when the WMA is moving lower.
This tactic emphasizes the importance of either purchasing an asset when its price is close to the rising WMA or selling an asset when its price is close to the falling WMA.
It is not the purpose of any moving average, including the WMA, to spot trade at the precise bottom or top of the price range.
Moving averages tend to confirm that your trade is in the general direction of the trend; nevertheless, there is often a wait at the entrance and exit when using them. The WMA has a much lower latency compared to the SMA.
Note
When reading WMA, you should use the same guidelines that apply to SMA. It is important to keep in mind, however, that WMA is often more sensitive to price volatility. This has the potential to be both a blessing and a curse.
How To Calculate The Weighted Moving Average
The formula for the WMA begins by locating averages for certain periods, after which it assigns a number to each average, multiplies those averages by the period, and then divides those results.

The following steps will walk you through calculating a weighted moving average:
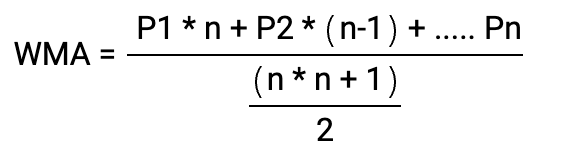
Where:
- WMA is the weighted moving average
- P = Price
- n = Time
Weighted Moving Average Example
Let's see a few examples and steps for calculating WMA:
1. Choose the values you want to average
Consider for a moment that we are interested in calculating the weighted moving average of Bitcoin prices for the most recent three weeks.
Using the price difference as a measure, we may assign more or less weight to weeks in which the average price of Bitcoin is higher or lower than a given threshold. This could be done either positively or negatively.
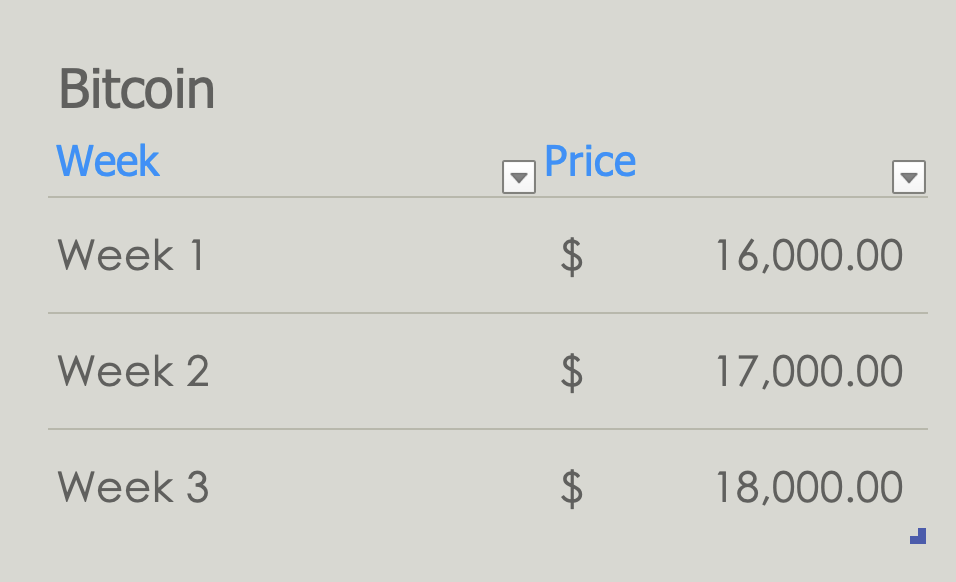
If the weekly average price of Bitcoin is $16,000 for the first week, $17,000 for the second week, and $18,000 for the third week, then we may give more weight to the third week's price since it was higher than the first two weeks' prices.
2. Figure out the relative values of each number
Since Week 3 has the greatest monetary worth, "1" would be its value since that week's total value is $18,000. Week 2 would be the second, as it is the second biggest number, while week 1 would be the third.
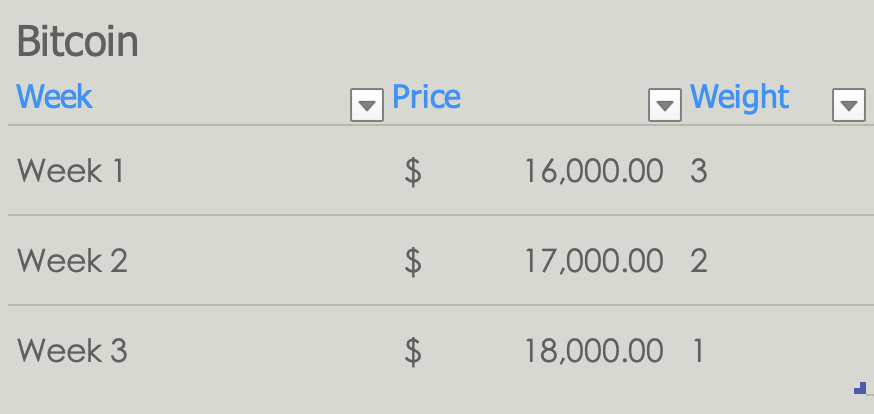
The total of those periods (1 + 2 + 3 = 6) must be determined for the denominator.
3. Perform a multiplication on each number using the weighting factor
Multiplying each price by the value assigned to it and then dividing the total by the number of periods results in the calculation of the WMA for the prior three weeks.
You'd need to do the following math:
[(1 x $18,000) + (2 x $17,000) + (3 x $16,000] / 6
The answer is 16,666, or 100,000/ 6.
Hence, the WMA for the past three weeks is $16,666.
Simple Moving Average Vs. Weighted Moving Average
WMA, or weighted moving average, and SMA, or simple moving average, are both technical analysis tools used to smooth out price data and help identify trends.
The moving average derives a new value for each moment in time by computing an average of all the data points that came before it. The value is then shown as a line on a trading chart, which may assist in reducing the amount of volatility in the price data and make it simpler to see patterns.
The primary distinction between the two methods is how WMA and SMA each weigh the previous data points. Each previous data point is equally important when calculating a simple moving average.
Note
If you were using a simple moving average for the previous 10 days, you would give each of the 10 data points from the most recent 10 days an equal weight of one-tenth of the total.
While calculating a weighted moving average, the prior data points are assigned varying weights according to the amount of time that has passed since they were recorded.
In a weighted moving average of 10 days, for instance, the most recent data point would be given a weight of 0.9, the second-most recent data point might be given a weight of 0.8, and so on.
This indicates that the most recent data points are given greater weight in the computation of the moving average. As a result, the moving average may be more sensitive to recent price movements.
Note
Both WMA and SMA may be helpful tools when it comes to studying price movements and making judgments about investments. However, the outcomes they yield might vary based on the weighting method used and the period that was investigated.
It is essential to have a solid understanding of the benefits and drawbacks associated with the various moving averages and the potential roles each might play in your overall investing plan.
One advantage of using WMA rather than SMA is that it may detect trends earlier. On the other hand, in contrast to an equivalent SMA, a WMA is likely to be subject to a greater number of whipsaws.


or Want to Sign up with your social account?