For an asset that should be easy to value and analyze, cash has been in the news a lot in the last few months, both when it has been returned (in buybacks especially) and also when it has been accumulated either domestically or offshore. Since companies have always returned cash and held cash balances, you may wonder why these stories are news worthy but I think that the cash is under the spotlight because of a convergence of factors, including the rise of technology companies in the market cap ranks, a tax law in the US that is increasingly a global outlier, and low interest rates.
Accounting for, Valuing, and Pricing Cash
I
start my valuation class with a simple exercise. I hold up an envelope with a $20 bill in it (which everyone in the class has seen me put into the envelope) and ask people how much they would pay for the envelope. While some find this exercise to be absurd, it does bring home a very simple rule, which is that valuing cash should not require complicated valuation models or the use of multiples. Unfortunately, I see this rule broken on a daily basis as investors mishandle cash in companies, both in intrinsic valuation and pricing models.
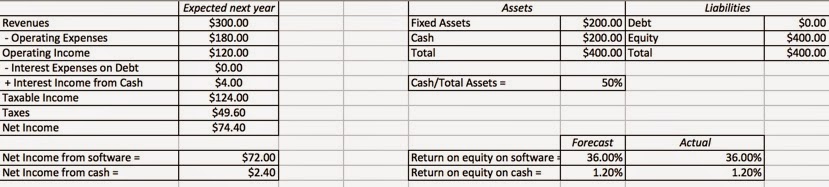
To illustrate the divide between risky assets and cash, assume that you are trying to value a software company, with a cash balance (which is invested in liquid, riskless or close-to-riskless investments) of $200 million. Let's assume that the
accounting income statement &
balance sheet for the company looks as follows:
If you believe the accounting
balance sheet, this company is half software and half cash but that is misleading for two reasons. The first is that assets on accounting balance sheets are not marked to market and can remain at low values, even as their earnings power rises. The second is that accounting rules (absurdly) treat R&D, the biggest capital expenditure at technology firms, as
operating expenses, which then results in those assets never showing up on the
balance sheet. The ripple effects of understating the
book value of equity can be seen in the high returns on equity that I report for the firm.
Having established that book-value cash ratios will be skewed by the changing composition of the market, let's turn to the question of valuing this company. For simplicity, let's assume
that the cost of equity for investing in the software business is 10% and that the expected growth in income from software is 2% in perpetuity. If we assume that the company can maintain its existing
return on equity of 36% on its new investments in perpetuity, the value of the software business is:
- Expected net income from software = $72 million
- Expected reinvestment to generate growth = 2%/36% = 5.56%
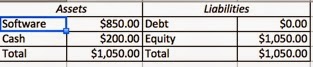
- Value of Software business = 72 (1-.0556)/ (.10-.02) = $850 million
The cash is invested in liquid, riskless investments earning 2% (pre-tax). The fact that cash earns a low rate of return does not make it a bad investment, because that low rate of return is what you should expect to make on a short-term, riskfree investment. If you decide to do an intrinsic valuation of the income from cash, you should discount the income at the
risk free rate:
- Expected pre-tax income from cash = $ 200 (.02) = $4 million
- Cost of equity = Riskfree rate = 2%
- Value of equity = 4/.02 = $200 million
Note that the software business is now worth a lot more than it was in the accounting balance sheet but that cash value remains unchanged. The value of equity on the balance sheet is an intrinsic
equity value.
In pricing, the tool used in comparisons is usually a multiple and the most commonly used multiple is the PE ratio. To set the table for that discussion, I have restated the intrinsic value balance sheet in the form of PE ratios for the software business, cash and equity overall.
The PE ratios for software and cash are computed by dividing the intrinsic values of each one by the after income generated by each. The PE ratio for cash can be simplified and stated as a function of the risk free rate and tax rate:
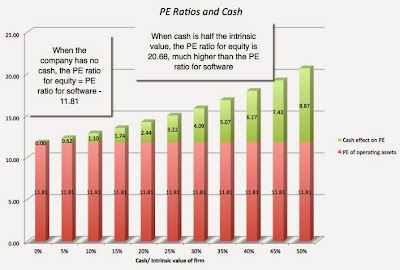
The PE ratio for cash is much higher than the PE for software (11.81) and it is pushing up the PE ratio for equity in the company to 14.11. Put differently, if the stock is priced based on its intrinsic value, it should trade at a PE ratio of 14.11.
How will bringing in debt into this process change the game? Let's assume that you borrowed $300 million and bought back stock in this company, while leaving the existing cash balance unchanged. Reducing your market cap by roughly $300 million will augment the effect of cash on PE and make the non-cash PE ratio even lower.
Cash Balances and PE: Determinants
In the market, we observe the
PE ratios for equity in companies, and those
PE ratios will be affected by both how much cash the company holds and the
interest rate it earns on that cash. To the extent that cash balances (as a percent of value) vary across time, across sectors and across companies, the conclusions we draw from looking at
PE ratios can be skewed by these variations. To observe how much of an impact the cash holdings have on the observed
PE ratio for a company, I varied the cash balance in my software company from 0% to 50% of the intrinsic value of the company; at 50%, the cash balance is $850 million and is equal to the value of the software business. The
PE ratio for equity in the company is shown in the graph below, with the cash effect on
PE highlighted:
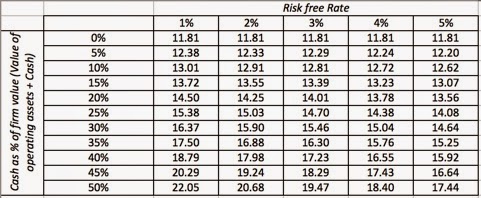
The effect of holding cash is accentuated when the interest rate earned on cash, which should be a short term risk free (or close to risk free) rate, is low relative to the cost of equity. In the table below, I highlight the interest rate effect, by holding the cost of equity fixed at 8% and varying the risk free rate from 1% to 5%:
Thus, a cash balance that amounts to 20% of firm value will push PE ratios from 15.38, when the short-term, risk free rate is 1% and to only 14.08, when it is 5%.
It is true that companies with global operations are accumulating some of their cash overseas to avoid US taxes. Bringing in trapped cash into this process is easy to do and requires you to separate cash balances into domestic and trapped cash; the biggest problem that you face is getting that information, since most companies are not explicit about the division. While the domestic cash balance is its stated value, the trapped cash will see its value reduced by the expected tax liability that will be incurred when the cash is repatriated (which will require assumptions about when that will be and what the differential tax rate paid on repatriation will amount to.)
The US Market: PE and Cash
At this point in this discourse, you may be wondering why we should care, since companies in the US have always held cash and had to earn close to a short-term risk free rate on that cash. That is true but we live in uncommon times, where risk free rates have dropped and corporate cash holdings are high, as is evidenced in this graph that looks at cash as a percent of firm value (market value of equity+ total debt) for US companies, in the aggregate, from 1962 to 2015 and the one-year treasury bill rate (as a proxy for short term, risk free rates):
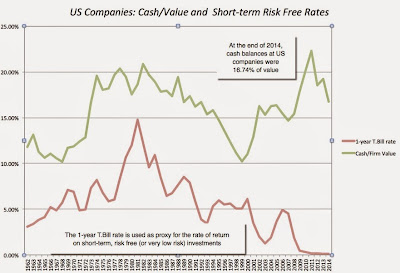 |
| Data from Compustat & FRED: Computed across all money-making companies |
With short-term risk free rates hovering around zero and cash balances close to historical highs, you would expect the cash effect on
PE to be more pronounced now than in the past. To measure this effect, I computed
PE ratios and non-cash
PE ratios each year for US companies, using the following equations:
The
interest income from cash was estimated using the average cash balance during the course of the year and average one-year T.Bill rate for that year. In the graph below, I look at the paths of both measures of
PE from 1962 through 2014. Note that while while both series move in the same direction, the
divergence has become larger since 2008; in 2014, the non-cash
PE was almost 30% lower than the conventional
PE.

Update: The PE effect is large, especially in the last five years. It is perhaps being exaggerated by the inclusion of financial service firms in the sample, since cash and short term investments at these firms can be huge and are really not comparable to cash holdings at other companies. If you remove them from the sample, the cash effect does get smaller. Rather than pick and choose which data I will report, I have included the year-by-year averages for the US for four sets of data: all companies, only non-financial service companies, all money-making companies and all non-financial money-making companies in this link.
I know that the talk of a bubble gets louder each day, and while there may be legitimate reasons to worry about the level of stock prices, those who base their bubble arguments entirely on
PE ratios (normalized, adjusted, current) may need to revisit their numbers. All of the versions of the
PE will be "pushed up" by the cash holdings of US companies and the low interest rate environment that we live in.
Sector Differences in Cash and PE
Cash balances have varied not only across time but they are also different across sectors and within sectors, across companies. Consequently, comparing
PE across sectors or even across companies within a sector, without adjusting for cash, can be dangerous, biasing you away from companies with large cash balances (which will look expensive on an unadjusted PE) and especially so during periods of low interest rates.
In the first part of the analysis, I estimated cash as a percent of firm value,
PE ratios and non-cash
PE for each sector in 2014. (I eliminated financial service companies from my sample, since I am not sure that I can categorize cash as a non-operating asset for these companies). While all of the industry averages can be downloaded at the link below, the sectors where the cash effect on
PE was greatest are listed below:
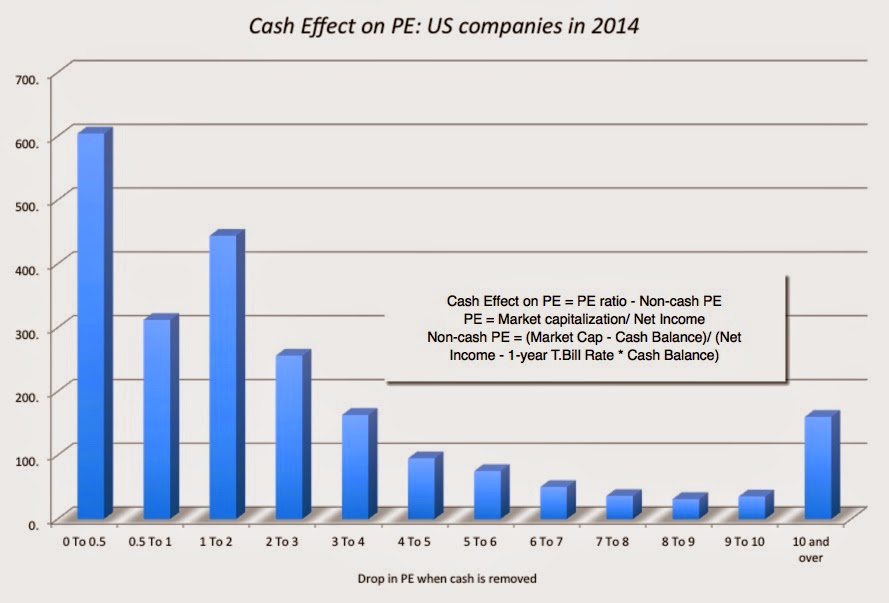
In the second part of the analysis, I computed the cash effect on PE for individual companies and then looked at the distribution of this cash effect across all companies:
It delivers the message that there is no simple rule of thumb that will work across all companies or even across companies within a sector.
Perhaps, the best way to check out the effect of cash on PE is to pick a company and take it through the cleansing process, a very simple one that requires relatively few inputs. Use this spreadsheet to try it on your favorite (or not-so-favorite) company.
Rules for dealing with cash
In an investing world full of complications, simple measures like
PE retain their hold because they are easy to compute and easy to work with. However, there is a price that we sometimes pay for this simplicity, and in periods like this one, where interest rates are at historic lows, we may need to reassess how we use these measures to compare companies. In particular, I think we have to separate companies into their cash and operating parts, and deal with the two separately, because they are so different in terms of risk and earnings power. Thus, it we are using multiples,
enterprise value multiples will work better than equity multiples, and with equity multiples, non-cash versions (where the cash is stripped from
market capitalization and net income is cleansed of the cash effect) will be more reliable than cash versions. This will also mean that the time honored way of estimating
PE, i.e., dividing the
market price today
by the earnings per share, will have to be replaced by an approach where we use
use aggregated market value, cash and earnings, rather than per share numbers.
Spreadsheets
- Intrinsic value of cash and operating assets (to back up example in post)
- PE Cleanser (to compute non-cash PE for a company)
Datasets
- Cash and non-cash PE ratios by year: All US companies
- Cash and non-cash PE ratios by sector in 2014


Great, now question is why would you value a company with a non-cash PE if your ultimately paying for the cash as well when your acquiring it? Was the purpose just to explain what is the effect of cash holdings in the rise of PE's among many companies?
I assume this holds true for DCF as well, and it should pertain only to non-operating cash ( cash held in excess of working capital needs)?
Yes, only for excess cash. You can assume 2% of cash used for Working capital depending of course on the sector and how volatile the cash flows are
Great post. Get balls deep in this market everyone......right now.
This is one example of many why the stock market is going higher over the next five years or so. Don't believe the people who assume a market near all-time highs means that the market is headed lower. The market is usually nears all-time highs because the market usually moves higher. Valuations are absolutely reasonable and compared to risk-free investments, the earnings yields are fantastic. Especially when you account for high corporate cash balances. I think the high corporate cash balances account, at least partially, for the unusually low volatility over the past few years.
Someone should mark this post and check in five years from now to see if I was right.
Thanks, very interesting.
Just thinking on the fly here but would another way of reaching a similar conclusion would be to excess cash adjust the price per share and then determine the P/E ratio? Seems like a more streamline way of using a simple P/E compared to your more complex analysis. In doing so you'd extrapolate the true value of cash per share from the P/E actually being generated by OpCo? (which would be lower as you pointed out).
So basically for companies with high P/E ratios that also have high cash balances in essence the P/E isn't as high is it may seem on first blush?
Aut voluptas autem dolorem quas et. Sit maiores voluptatem voluptas sed corrupti odit assumenda optio. Commodi et dolorem officia enim ea consequatur reprehenderit. Enim nihil sit qui sed labore nisi ea totam.
See All Comments - 100% Free
WSO depends on everyone being able to pitch in when they know something. Unlock with your email and get bonus: 6 financial modeling lessons free ($199 value)
or Unlock with your social account...