BINOM.DIST.RANGE Function
Calculates the binomial distribution using the specified parameters


What Is the Binomial.DIST.RANGE Function?
The binomial distribution is a probability distribution that gives the probability of a certain number of successes in a series of Bernoulli trials.

In Excel, the Binomial.DIST.RANGE function calculates the binomial distribution using the specified parameters. This function accepts the following arguments:
- Trials: The number of trials to be performed.
- Success Rate: Probability of success on each trial.
- Lower bound: Lower bound of the range of values.
- Upper bound: Upper limit of the range of values.
This function returns the binomial distribution for the specified parameters. This function can calculate the probability of a given number of successes for a given range of values. It can also calculate the likelihood of a given number of failures in a given range of values.
The series of independent trials can result in one of the two mutually exclusive possibilities, i.e., success or failure in each trial is constant. Repeated separate trials are known as ‘Bernoulli trials.’
This distribution model is used in statistics but has implications for finance and other fields. For example, banks can use it to assess the likelihood of a particular borrower's default or to determine loan amounts and reserves. The insurance industry also uses it for policy pricing and risk assessment.
The range is the difference between the highest observation and the lowest observation.
Formula of range = Highest observation - lowest observation.
It is the difference between the highest and lowest observations. For example, if the given data set is 15,18,10,11, the range will be 18 – 10 = 8.
Thus, it is the difference between the highest and lowest observations. The obtained result is called the range of observation. It, in statistics, represents the spread of observations or values.
- The binomial distribution is a probability distribution used in statistics to model the probability of a specific number of successes in a series of independent trials called Bernoulli trials. These trials have only two possible outcomes: success or failure.
- Excel provides the Binom.Dist.Range function to calculate the binomial distribution using specific parameters. The syntax is BINOM.DIST.RANGE(test_number, probability_success, range_number).
- While primarily used in statistics, the binomial distribution has applications in finance, insurance, and various fields. For instance, banks can use it to assess default probabilities, and the insurance industry employs it for policy pricing and risk assessment.
Binom.Dist.Range function Syntax in Excel
The Excel Binom.Dist.Range function returns the binomial distribution probability for the number of successes from a specific number of attempts within a particular range.
P(x: n.p) = nCx px (q)n - x
- n = the number of trials
- x = 0,1,2,3,4,5,6,7,..........
- p = Probability of Success
- q = Probability of Failure, q = 1-p
The syntax of BINOM.DIST.RANGE in Excel is:
BINOM.DIST.RANGE(test_number, probability_success, range_number)
This function calculates the probability of achieving a specific number of successes in a given number of attempts before the likelihood of success. The function returns a value between 0 and 1.
The terms of syntax:
- Trials/test_number: The number of independent trials. It ought to be extra than or identical to zero.
- Probability_s (Required): Probability of achievement for every trial. Need to be greater than or identical to 0 and less than or equal to 1.
- Number_s (Required): Quantity of successes in exams. It must be greater than or equal to zero and less than or equal to the test.
- Number_s2 (optionally available): If provided, returns the chance that the variety of successful attempts is between Number_s and number_s2. It should be extra than or identical to Number_s and less than or the same to Trials.
Note
The BINOM.DIST.Range feature changed into brought in MS Excel 2013 and consequently is unavailable in older versions.
For instance, in monetary analysis, the characteristic may be beneficial in locating the possibility of, for example, the three bestselling products from various merchandise manufactured by an organization.
The BINOM.DIST function is classified as Excel's statistical functions. It calculates the binomial distribution probability for the number of successes from a particular number of attempts.
It is a statistical measure commonly used to indicate the probability that a particular number of successes will occur from a specific number of independent trials. The two forms used are
- Probabilistic Mass Function: Calculates the probability of having precisely x successes and failures from n independent attempts.
- Cumulative distribution function: Calculates the probability of having at most x successes from an independent try.

How to use the BINOM.DIST.RANGE Function?
Let us take a few examples to understand the concept better.
A flight from Mumbai to Ahmedabad occurs 6 times daily. The probability that any 1 flight is late is 10%. What is the chance that exactly 2 planes are late? Less than 2 are late? A possibility that between 1 and 3 planes will be late?
| Example | ||
|---|---|---|
| 1 | Fixed # of identical trials = n | Yes |
| 2 | Each trial only results in Success or Failure | Yes |
| 3 | P remains the same for each trial | Yes |
| 4 | All events are independent | Yes |
So here is the binomial experiment shown in the picture.
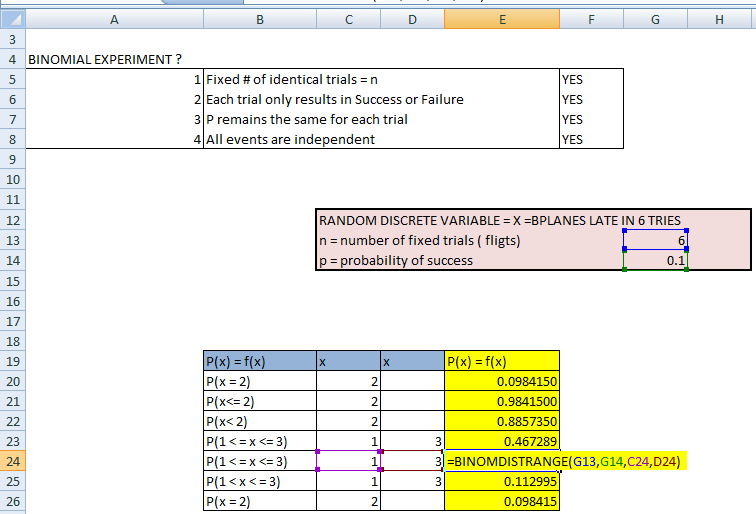
Use the formula:
=BINOMDISTRANGE(G13,G14,C24,D24) Here: P(x = 2)
- Cell C24 means the x = 1
- Cell D24 means the x = 3
- Cell G13 means the number of trials is 6 (fig 2)
- Cell G14 means the probability of success is 0.1 (fig 2)
So the final answer is 0.467289.
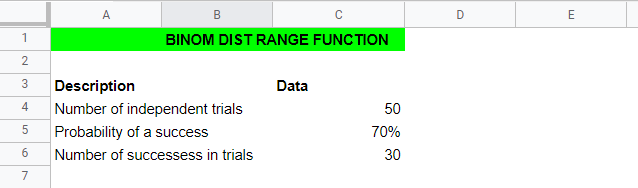
Let's take the next example. Number of independent trials = 50, probability of success = 70%, number of successes in trials = 30.
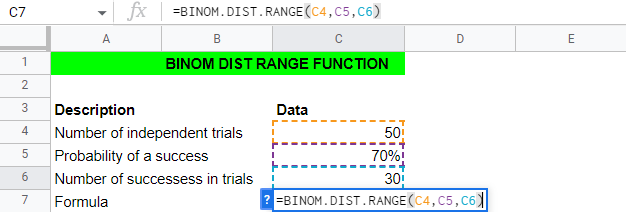
As seen in the images above, we can easily find the binomial distribution range. So the answer is 0.037039.
Characteristics of binomial distribution
The binomial distribution is the function that returns the binomial distribution for the specified parameters. Its feature calculates the probability of a given number of successes for a given range of values.
It calculates the probability of a positive number of errors given a specified number of values.
- Binomial distribution has parameters n and p.
- The mean of the binomial distribution is np.
- The variance of the binomial distribution is npq.
- The standard deviation of binomial distribution √npq.
- The mean is usually extra than the variance.
- The mode of the binomial distribution is that fee of the variable, which takes place with the most significant chance.
- The chance of outcome of any trial is unbiased of the result of the previous attempt.
- The outcomes of every trial are characterized by using two attributes, particularly success or failure.
- The shape and region of the binomial distribution modifications as p change for the given n. As p increases for the constant n, the binomial distribution shifts to proper.
- If impartial random variables X and Y comply with binomial distribution with parameters (n1, p) and (n2, p), respectively, then their sum (X+Y) also follows Binomial distribution with parameter (n1 + n2, p).
Applications of Binomial Distribution Range
There are ample applications of binomial distribution in real life that the use of binomial distribution range can solve. It is to find out the occurrence of an event, or we can say the occurrence of an event with the number of trials, successes, and failures.
BINOMDIST RANGE is calculated through the given parameters.
- Manufacturing industries use several defective items.
- It is used in marketing research and trends, such as the probability of an event in stock markets.
- It is used in the medical field for sample tests of medicines and patient samples.
- This is used in data science for analyzing the data.
- It can be used in Excel for graphical representation from an analytical perspective.
- Financial persons from the financial analysis perspective may use it.
- The statistician uses it for the statistical representation of data in Excel for the overview of data interpretation.
- This can be used for the number of flights delayed or for the number of persons who are late.
- For finding the number of successes and failures in events such as toss playing, rolling of dice, and any other event.
The above points are the applications of binomial distribution in our daily lives. From the points mentioned above, we understand its applicability.
Similar Functions to BINOM.DIST.RANGE Function
Excel worksheets have the following built-in functions regarding the binomial distribution:
1. BINOM.DIST(x, n, p, cum)
The probability of opportunity density characteristic f(x) for the binomial distribution (i.e., the opportunity that there are x successes in n trials wherein the opportunity of fulfillment on any trial is B(n, p) while cum = FALSE.
The corresponding cumulative opportunity distribution f(x) (i.e., the opportunity at maximum x successes in n trials wherein the opportunity of fulfillment on any trial is p) while cum = TRUE.
2. BINOM.INV(n, p, 1 – α)
Critical cost, i.e., the smallest payment x where F(x) ≥ 1 – α, where F is the cumulative property of the binomial distribution B(n, p).
These properties are not supported in versions before Excel 2010; instead, the following properties are used: BINOMDIST corresponding to BINOM.DISTRIBUTOR and CRITBINOM correspond to BINOM.INV.
The syntax for BINOM.INV is as follows:
BINOM.INV (trials, probability, alpha)
- trials: total number of trials
- probability: the probability of success on each trial
- alpha: value between 0 and 1
Examples: A coin is flipped 10 times. Calculate the probability of getting 4 heads using a binomial distribution formula.
- Number of success in trials (x) = 4
- Number of independent in trials (n) = 10
- Probability of success in trials (p) = 0.5
It is simple to use the Excel solution.
BINOMDIST (x,n,p,0)
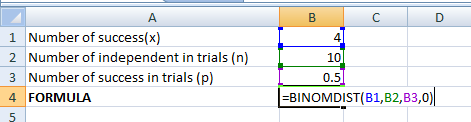
Here, 0 is the cumulative means false.
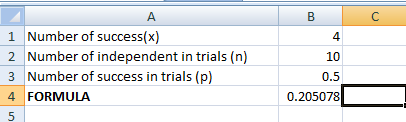
The answer is 0.205078
In this example, trials are 20, the probability of success is 0.3, and the alpha is 0.65.
Solution Using Excel, the solution is easy to comprehend
BINOMINV (trials, probability of success, alpha)
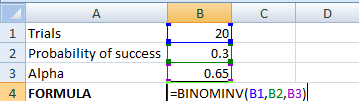
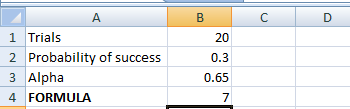
The answer is 7.
Zen flips a coin 5 times. What is the probability that the coin lands on heads between 2 and 4 times?
Solution Using Excel, the process of obtaining the solution is time-saving
n=5, p=0.5, range number= 2&4
BINOM.DIST.RANGE(5, 0.5, 2, 4)
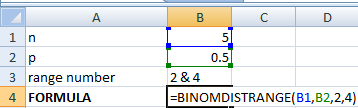
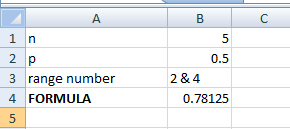
The answer is 0.78125

Free Resources
To continue learning and advancing your career, check out these additional helpful WSO resources:


or Want to Sign up with your social account?