COVARIANCE.S Function
One of the functions under the category of Excel Statistical Function utilized to sample the covariance of two sets of data to measure the relationship between them and how they vary.

What is the COVARIANCE.S Function?
The COVARIANCE.S Function is one of the functions under the category of Excel Statistical Function that is utilized to sample the covariance of two sets of data to measure the relationship between them and how they vary.
COVARIANCE.S is one of two covariance functions that return the covariance of two random data sets.
Covariance measures the joint variability of two random data sets. Depending on the nature of the relationship, it can be positive, negative, or zero. Covariance can be calculated using a mathematical formula or Excel.
As mentioned above, Excel has two covariance functions - COVARIANCE.P and COVARIANCE.S.
First, we have a COVARIANCE.P function. The function returns population covariance (calculated over the entire data set). Then, there is a COVARIANCE.S function, which returns sample covariance (calculated over a sample).
This article concentrates on COVARIANCE.S function.
COVARIANCE.S function falls under the statistical functions category. It is one of the two functions that replaced the COVAR function. Both new functions provide improved accuracy, and their names better reflect their usage.
At the same time, the COVAR function is still available in the latest Excel version for comparability with excel 2007 and earlier versions.
Covariance is widely used in the fields of science, such as biology and micrometeorology. It is considered significant in finance and modern portfolio theory.
- The COVARIANCE.S function is a Statistical Function in Excel used to calculate the covariance between two sets of data points, representing their degree of linear association.
- Users provide two arrays of data points, one for each variable. Based on sample data, the function returns the covariance between the two variables.
- COVARIANCE.S function aids in statistical analysis by quantifying the strength and direction of the linear relationship between two variables, providing insights into their co-movement and potential dependencies.
- Potential errors that users might encounter when using the COVARIANCE.S function, such as providing arrays with unequal lengths or referencing cells with incorrect data, and how to address them effectively.
Sample Covariance explained
Covariance defines the relationship between the two data sets. In other words, it evaluates to what extent and how much the mean values of two data sets move together. However, it does not measure the dependency between those data sets.
Covariance could be:
- Positive: Occurs when two random data sets move in the same direction (simultaneous increase/decrease in value of two data sets).
- Negative: Occurs when two random data sets move in the opposite direction (an increase/decrease in the value of one data set is accompanied by the decrease/increase in the value of another data set).
- Zero: Occurs when the values of two random data sets do not vary together.
Note
Covariance could be calculated for the entire population (population covariance) and the sample (sample covariance).
When a population is too large, one may refer to samples to analyze the data sets. The formula for calculating sample covariance between X and Y data sets is as follows:
Cov (X,Y) = [Σ(Xi - μ)(Yj - v)]/ (n -1)
Where the parts of the equation are:
- Xi – data value of X
- μ – mean value of X
- Yj – data value of Y
- ν – mean value of Y
- n – number of data values
In Excel, the COVARIANCE.S function returns the equivalent result.
How to use the COVARIANCE.S Function in Excel?
One of the greatest features of Excel is that it simplifies your life when dealing with data. Using one of the functions, you can calculate the sample covariance simply.
1. Function access
There are three ways to access the function in Excel:
A. Formulas tab:
COVARIANCE.S is a statistical function that returns covariance for the sample. It can be found in Excel under the Formulas tab:
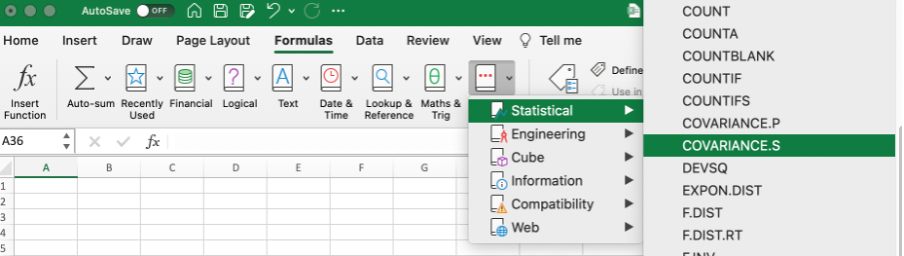
After you select the function from the list, the formula automatically appears. All you have to do is to select the arguments needed for the function to operate correctly.
B. Entering the formula into the worksheet:
Alternatively, you can click on any cell in a worksheet and type the formula. The formula for the COVARIANCE.S function is:
=COVARIANCE.S(array1;array2)
The function uses the following arguments:
- Array 1: The first cell range of integers, and must be numbers, arrays, or references containing numbers.
- Array 2: The second cell range of integers, and must be numbers, arrays, or references containing numbers.
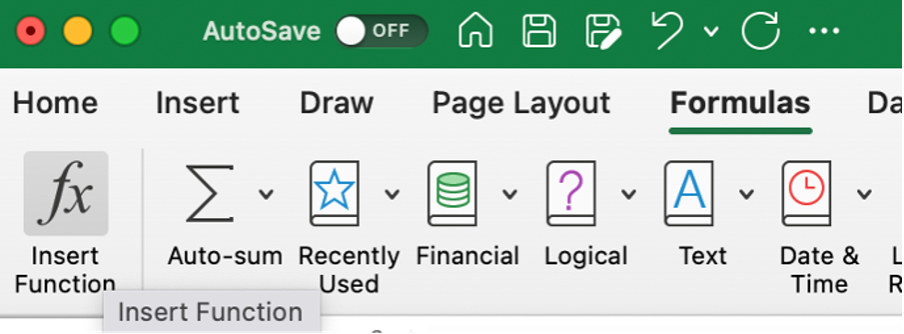
C. Utilizing the formulas tab with manual input:
Finally, you can simultaneously utilize the Formulas tab and the manual input of the formula. Select any cell in a worksheet, continue to the Formulas tab, press the Insert Function button, and start typing the formula.
2. Sample covariance example
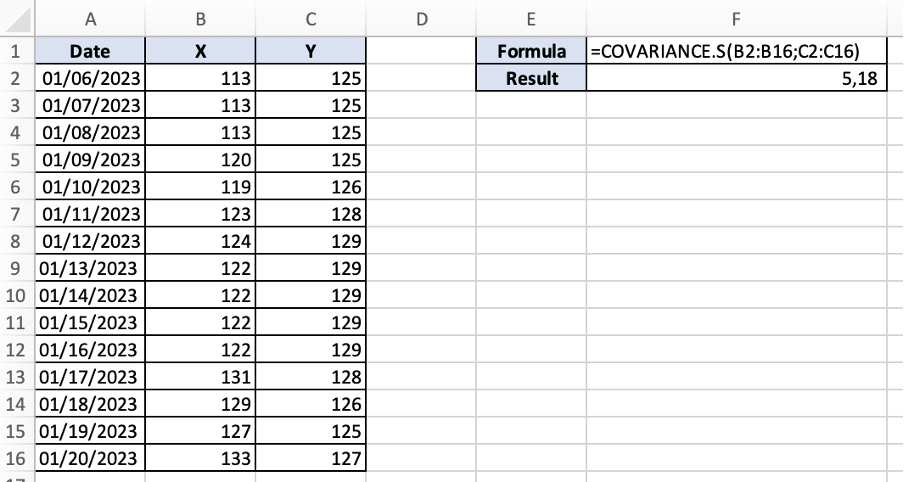
Let's consider the share prices of two companies, X and Y, for 15 days.
- Array 1 (data in cells B2:B16) represents the share prices of company X.
- Array 2 (data in cells C2:C16) represents the share prices of company Y.
The goal is to understand the relationship between companies X and Y's share prices, if any.
As we can see from the calculation below, the result returned by the function is positive 5,18, indicating a positive covariance between the share prices of the two companies (when the share prices of company X go up, the share prices of company Y follow the same pattern).
3. Things to consider when using the function
Like with any other Excel function, some things need to be considered when using the function. Some things to consider:
- The formula considers only the arguments that are either numbers or names, arrays, or references that include numbers; all other values are ignored.
- The arguments must have the same number of data points; otherwise, the function returns the #N/A Error value.
- If either of the arguments is empty or contains only 1 data point each, the function returns the #DIV/0! Error value.
- There are two cases when the function may lead to inaccurate results. First, when the sample size is too small. Second, when the data set contains many outliers.

Free Resources
To continue learning and advancing your career, check out these additional helpful WSO resources:


or Want to Sign up with your social account?