NEGBINOM.DIST Function
An Excel Statistical Function that calculates the negative binomial distribution probability for a given number of successes in a sequence of independent Bernoulli trials.


What is NEGBINOM.DIST Function?
The NEGBINOM.DIST function is an Excel Statistical Function that calculates the negative binomial distribution probability for a given number of successes in a sequence of independent Bernoulli trials.
It is used to determine the probability of achieving a specified number of failures before a target number of successes is reached.
From the countless articles on Excel, we know one thing, though - these formulas and mathematical concepts look tough but aren’t so.
All you need to do is spend some time understanding them and will understand their use cases.
Back to the topic, a negative binomial distribution is a probability distribution that models the number of failures before a certain number of successes are achieved through Bernoulli trials.
Still confused? Don’t worry; we will explain in depth what it means and explain how the distribution will benefit you.
But what's the formula to calculate the negative binomial distribution in Excel? The NEGBINOM.DIST function can help.
- The NEGBINOM.DIST function is an Excel Statistical Function used to calculate the probability mass function or cumulative distribution function for a negative binomial distribution.
- Users provide arguments, including the number of failures, the number of successes, and the probability of success in each trial. The algorithm returns the probability of observing a specific number of failures before a specified number of successes occur.
- NEGBINOM.DIST function aids in statistical analysis by modeling the number of failures that occur before a predetermined number of successes, providing insights into the likelihood of achieving a certain number of successes within a given number of trials.
- Potential errors that users might encounter when using the NEGBINOM.DIST function, such as providing non-numeric values or referencing cells with incorrect data, and how to address them effectively.
What is Negative Binomial Distribution?
A negative binomial distribution is a probability distribution wherein an event may have two outcomes, i.e., failure or success, which you call Bernoulli’s trials.

The distribution is used to model a situation where a certain event repeatedly occurs until a specified number of successes are obtained based on the ‘n’ number of trials.
For example, suppose you are shooting three-pointers on the court. Your objective is to score at least 10 three-pointers in 2 minutes. Unless you are Steph Curry and know how to cook, it's almost next to impossible that you make 10 out of 10.
The next best alternative? Make random shots and pray that at least ten go in before the timer goes out.
By the end of two minutes, you made 10 three-pointers and took 40 shots in total.
Thus, you needed to see 30 failures before you could finally get 10 of those three-pointers in the basket.
We will see more in-depth examples as to what arguments you need to consider to calculate the negative binomial distribution but just remember, those two are crucial variables in this journey.
NEGBINOM.DIST Function Formula
NEGBINOM.DIST is categorized as a statistical function that calculates the probability of negative binomial distribution.
Previously, we saw what we mean by a negative binomial distribution. To iterate it with another example, think you have a coin and need to land three tails. The probability that the coin will land tails is 50%.
Thus, the number of times the coin is tossed and its consecutive failures and successes form the foundation of the negative binomial distribution.
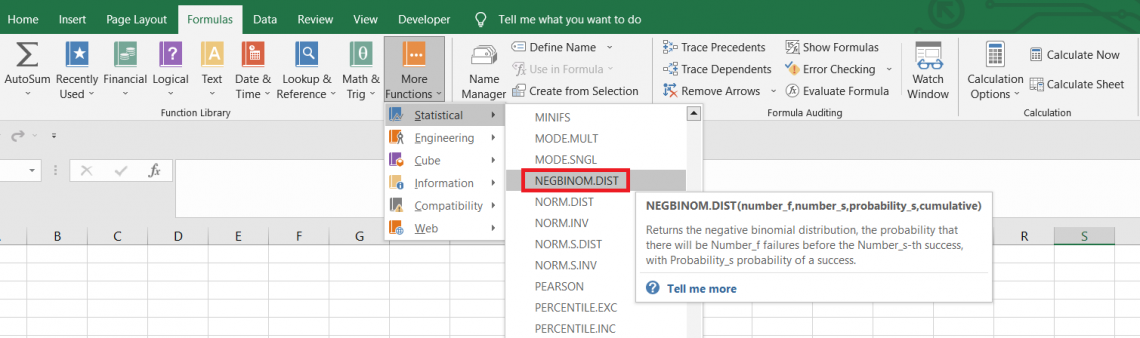
The syntax for the function is:
=NEGBINOM.DIST(number_f, number_s, probability_s, cumulative)
where,
- number_f - (required) the total number of failures that will occur before number_s successes.
- number_s - (required) the total number of successes
- probability_s - (required) probability of success in one simulation
- cumulative - (required) determines the type of negative binomial distribution. It can accept only two values, i.e., the booleans. When the value is TRUE, the function uses the cumulative distribution function, and when it is FALSE, the function uses the probability mass function.
Returning to our example of the coin toss, let’s say that it took 7 failures before we had three successes for landing tails. The probability is still at 50%. Therefore, the negative binomial distribution would be equal to 0.945313.
Thus, the result can be interpreted as having 0.945313 or 94% likelihood of having seven or fewer failures before three successes for landing tails.
How to use the NEGBINOM.DIST Formula in Excel?
We saw the syntax for the function along with a really simple example. But now, let’s get some serious work done.

Suppose you have a day trade in Nvidia Inc based on the support and resistance lines. As a degen trader, you believe that you will make four profitable trades during the trading horse.
The probability of those profitable trades is almost the same as someone talking about the Fight Club.
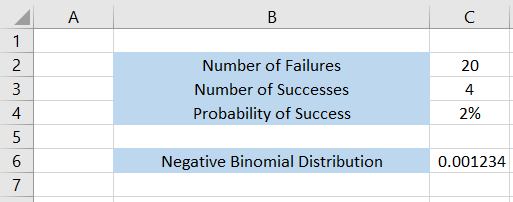
Still, the gods are gracious, and you make 20 failure trades before four are profitable. So don’t even ask about net profit/loss. The data looks as illustrated below:
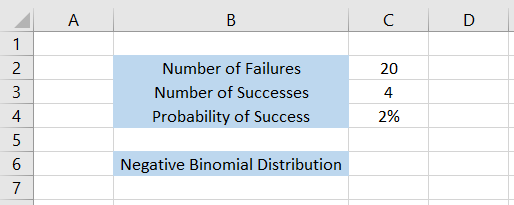
We will use the formula =NEGBINOM.DIST(C2,C3,C4,TRUE) calculates the negative binomial distribution as 0.12%.
Thus, there is a 0.12% probability of 20 or fewer failures before having four successful trades. Sounds promising, right?
If we use the cumulative argument as FALSE, the result becomes 0.2%.
What do we interpret here?
It means there is a 0.2% probability that it will take exactly 20 failures before we have four successful trades.
The boolean value can significantly impact the result and its interpretation, so be careful as to how you use it in the spreadsheet.
Let’s see another example to understand the function better.
Suppose we have a coin where we want four tails. The probability of success is equal to 50%. The number of failures before we have four tails is equal to 2. What would be its negative binomial distribution?
The data looks as illustrated below:
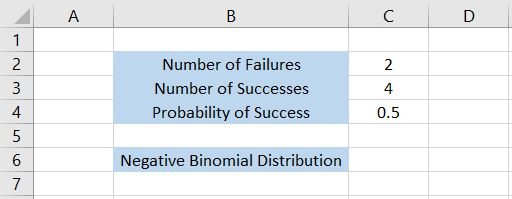
First, we will find the cumulative distribution function by keeping the value TRUE for the cumulative argument wherein the formula becomes =NEGBINOM.DIST(C2,C3,C4,TRUE) to give the result as
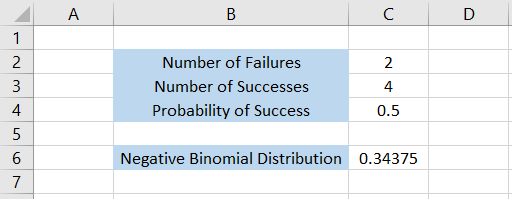
Thus, there is 0.34375 or 34.37% probability that it will take 2 or fewer failures before having 4 successful tails on the coin.
If we use the value as FALSE for the cumulative argument, the formula becomes =NEGBINOM.DIST(C2,C3,C4,FALSE) to give the result:
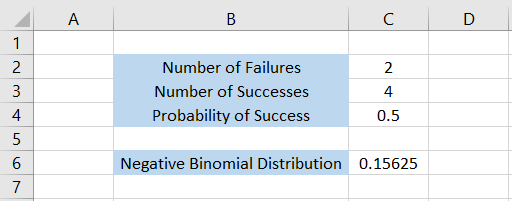
As per the probability density function, there is 0.15625 or 15.62% probability that it will take exactly 2 failures before we have 4 successful tails on the coin toss.

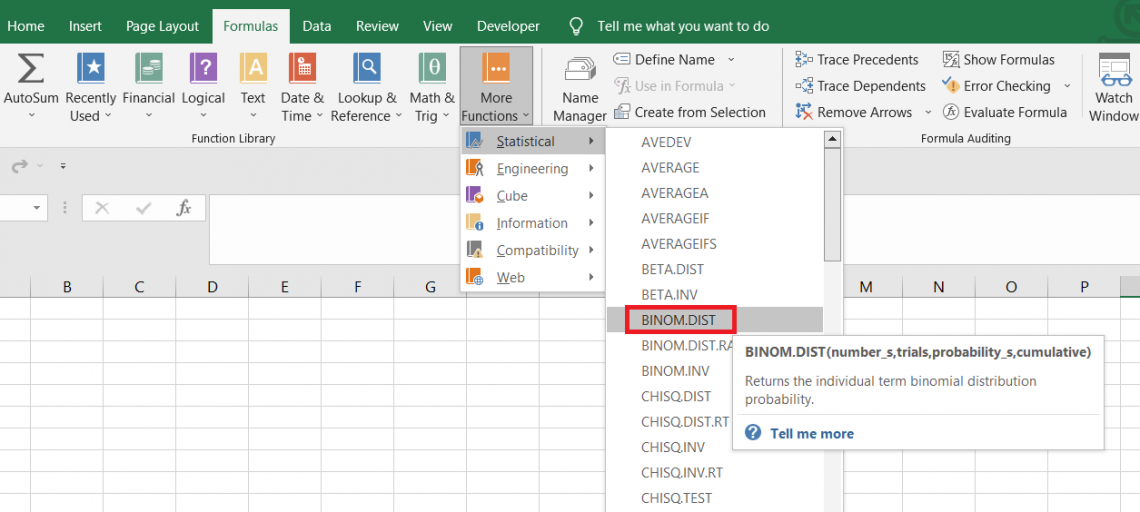
What is BINOM.DIST Function?
There’s another function that might confuse you if you are to use the NEGBINOM.DIST function, which is none other than BINOM.DIST.

You would ask - “What’s the difference between a negative binomial distribution and a binomial distribution?”
The major difference between the both is that binomial distribution models the number of successes based on a fixed number of trials, whereas negative binomial distribution models the number of trials needed to achieve a fixed number of successes.
The BINOM.DIST is categorized as a statistical function used to calculate the probability of achieving a specified number of successes for a fixed number of trials in a binomial distribution.
Let’s take an example to understand function better. Suppose you can only toss the coin ten times. If you expect to get at least three heads, the function will give you the probability of achieving those three heads from the possible ten coin tosses.
The syntax for the function is:
=BINOM.DIST(number_s, trials, probability_s, cumulative)
Where,
- number_s - (required) the total number of successes
- trials - (required) total number of trials
- probability_s - (required) probability of success in one simulation
- cumulative - (required) determines the type of binomial distribution. It can accept only two values, i.e., the booleans. When the value is TRUE, the function uses the cumulative distribution function, and when it is FALSE, the function uses the probability mass function.
Let’s see an example to understand how the function works.
Suppose an athlete is asked to finish a 100m dash in 30 seconds. There are just two probabilities - either they will be able to cover it, or they wouldn’t. The athlete will be presented with seven opportunities to run the 100m dash.
What will be the probability that they can have four successes out of the possible seven opportunities?
The data looks as illustrated below:
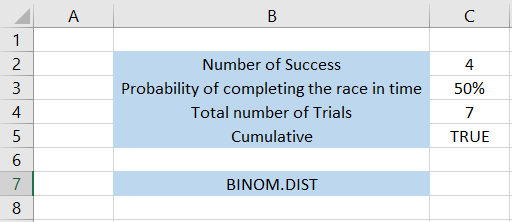
We will use the formula =BINOM.DIST(C2,C4,C3,TRUE), which gives the result as 0.7734 or 77%.
Thus, we can interpret the result as a 77% probability of completing four 100m dashes in seven possible tries.

We input the cumulative argument as TRUE, which calculates the cumulative distribution function.
On the other hand, if the argument were FALSE, the formula would have been =BINOM.DIST(C2,C4,C3,FALSE) to give the result as
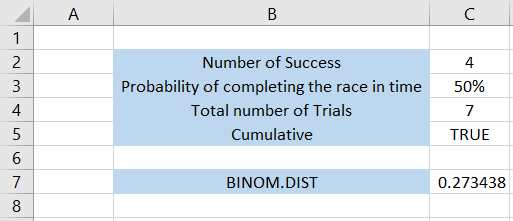
This gives the probability of 0.2734 or 27%. What we did was calculated the probability mass function. The result can be interpreted as the probability of an event having exactly ‘n’ number of successes.
Thus, the probability that the athlete can complete an exact four 100m dash in the given time from the possible seven is 27%.

Free Resources
To continue learning and advancing your career, check out these additional helpful WSO resources:


or Want to Sign up with your social account?