PHI Function
It returns the value of the density function for a standard normal distribution for a given number


What Is The PHI Function?
The PHI function in Excel returns the value of the density function for a standard normal distribution for a given number.

We bet you did not understand even 1% of what the function does from the above statement. It's alright!
It is one of those unknown functions that even most Excel wizards haven't heard of. The function is difficult to understand, and it's tough to determine its practical use in everyday life. As a result, you won't mostly hear its praises from fellow Excel users in the community.
However, that shouldn't stop us from our objective of acquiring more knowledge on our path to becoming an Excel wizard. That is why we are here to simplify the function for you. By the end of this article, we ensure that you will have a good understanding of the function and its related jargon.
In this article, we will understand the PHI function, its syntax, how to use it, and a couple of examples to understand it better.
- The PHI function in Excel calculates the density function value for a standard normal distribution based on a given number.
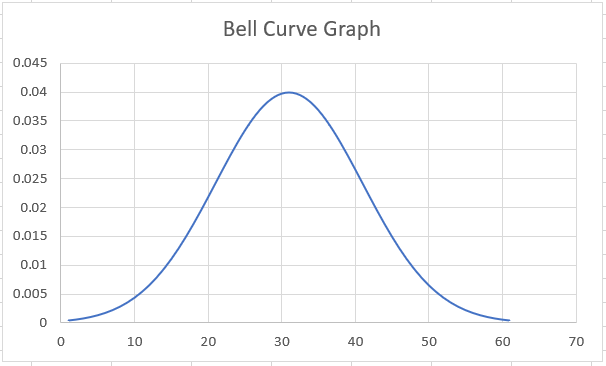
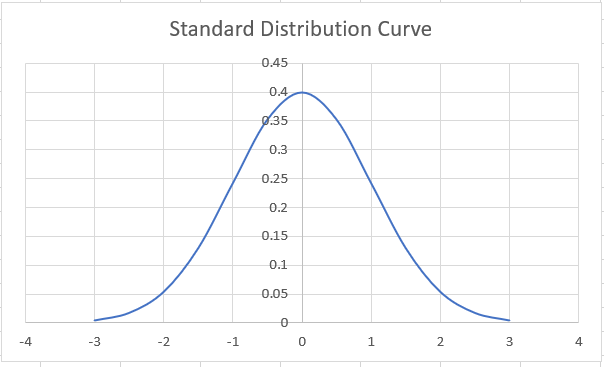
- A normal distribution, depicted as a bell curve, concentrates values around a central region. The standard normal distribution has a mean of 0 and a standard deviation of 1, and its density function provides probabilities for values within a range.
- The PHI function returns the density function value for the standard normal distribution with a mean of 0 and a standard deviation of 1. It can be used to assess probabilities of specific values.
- The syntax of the PHI function in Excel is simple: =PHI(x), where x is the value for calculating the density function.
Standard normal distribution
One of the first few questions you should ask is, what is a normal distribution?
A normal distribution is a bell-shaped graph where most values are concentrated around a central region and recede in numbers as we leave the center.
Some standard distribution variables are height, birth weight, SAT scores, blood pressure, or even measurement errors.
But wait, there is also a 'standard' before normal distribution. Does that change the description for the term? Just a little bit.
All normal distributions, including the standard normal distribution, have only the single highest value for mode. For example, they are unimodal and symmetrically distributed in a bell-shaped curve.
The only difference is that the standard normal distribution or the z-distribution has the value of mean equal to zero and the standard deviation as one. In contrast, the former could take any value as its mean and standard deviation.
It clears what a standard distribution curve is. Now, let's see the 'density function' for a standard normal distribution.
Probability density function
The probability density function(PDF) is a statistical concept that provides the likelihood of a value of a random variable falling between a specific range of values.
The function is most likely used when dealing with continuous random variables in statistics.
Let's say that you draw a graph for probability 'n' with the X-axis consisting of the range of values while the Y-axis comprises the probability density function.
Suppose you want to find the probability of, let's say, 20. In that case, you can determine it by drawing a perpendicular line on the graph and then extending it horizontally towards the probability distribution values as illustrated below:
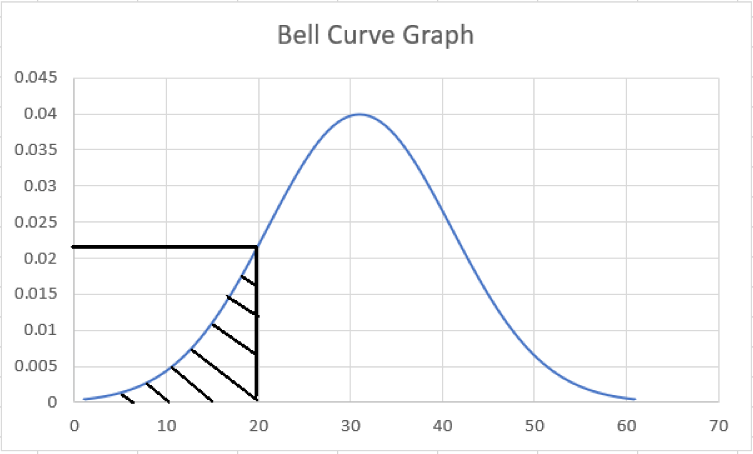
The area marked on the left-hand side of the bell curve graph gives the probability that the value will be 20 or less as 0.23.
Even though the graph above is a normal distribution (and not a standard), those rules still apply to either. The probability density function essentially describes the probability regarding the continuous random variables that will lie in a range of values.
Understanding the PHI function in Excel
The PHI function is categorized as a Statistical function that returns the value of the density function for a standard normal distribution for a given number.

For example, when you have the given number(x) equal to 1 and use the PHI function, then the value of the probability density function would be equivalent to 0.241971.
The function assumes that the mean value is equal to zero. At the same time, the standard deviation is similar to one and, based on those assumptions, returns the value of the density function equal to 0.241971.
If you change the value of x to 2, the result will be equal to 0.053991.
Rather than dwelling too deeply into those statistical terminologies, it's best to look at the syntax for the function so that we are one step closer to looking at the examples for the position.
The syntax for the function is:
=PHI(x)
where,
- x = (required) the numerical value for which we want to calculate the density function for a standard normal distribution

How to use the PHI function in Excel?
There are essentially two methods with which you can use the function - either from the library or as a worksheet formula. This section will explore both ways to understand how the function works.
Method #1: From the Functions Library
Libraries are a great place to explore the functions and search and select them based on the categories they are divided into.
The various categories in the library are Financials, Statistical, Logical, Text, etc.
To use the functions from the library, please follow the steps below:
1. First, select the cell in which you intend to get the result.
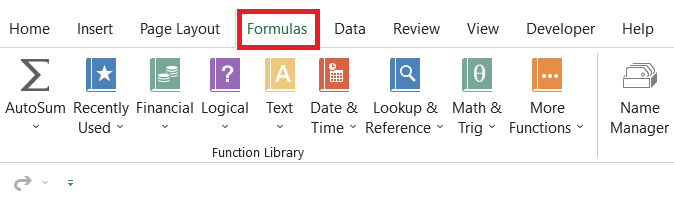
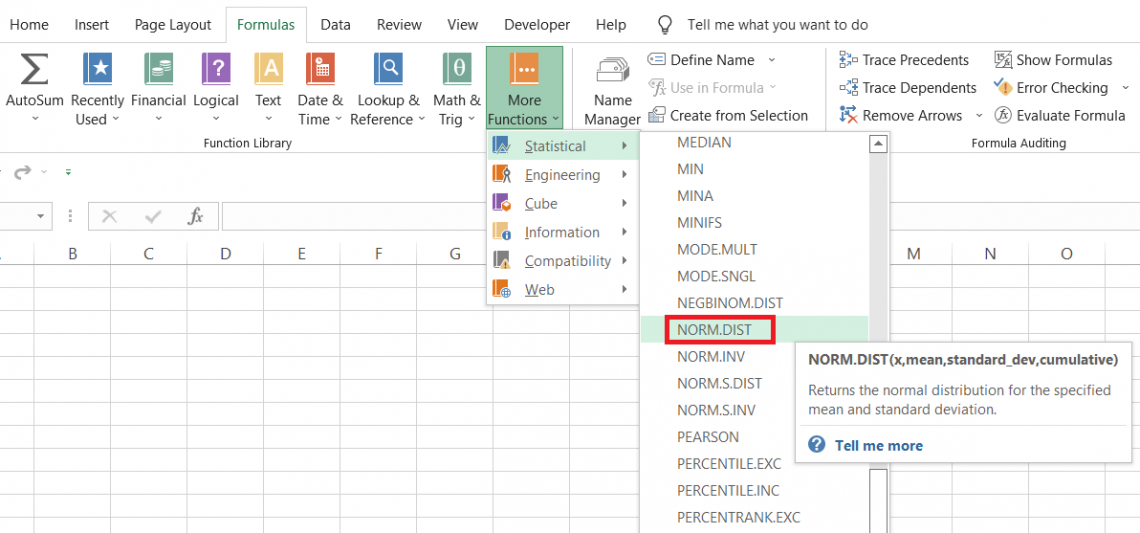
2. Click on the Formulas > More Functions > Statistical > select the PHI function from the drop-down menu.
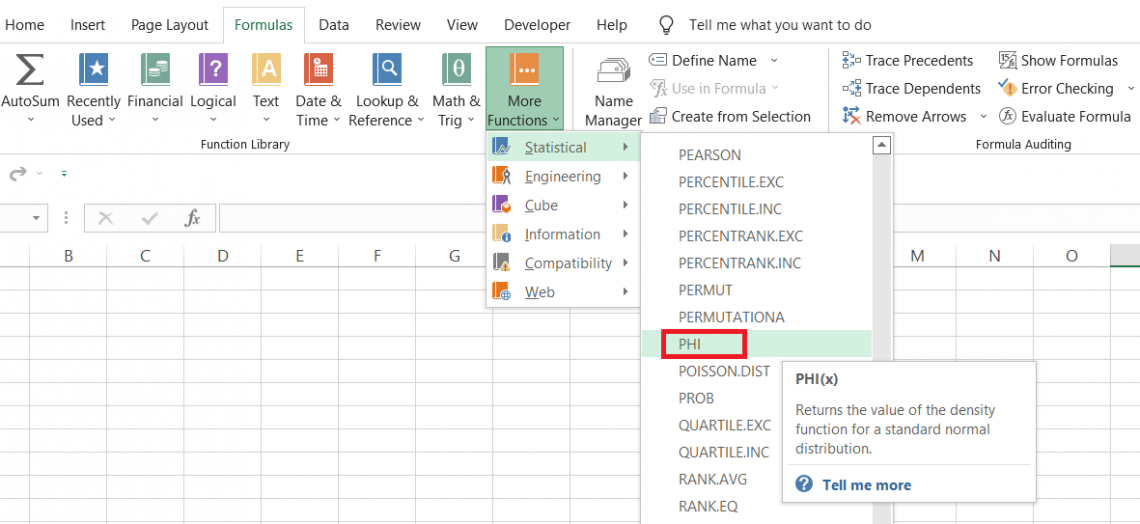
3. This will open up the dialog box, as illustrated below.
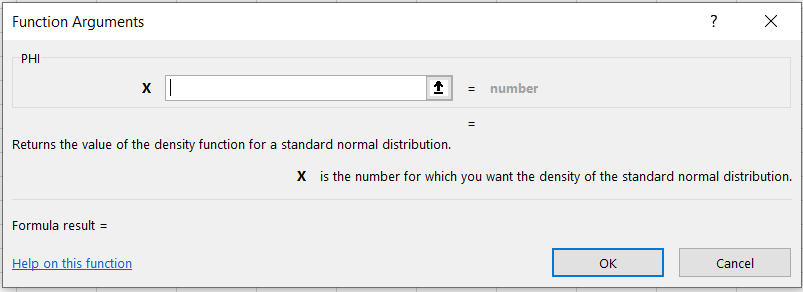
4. Here, we will input the number we want to calculate the density function based on a standard normal distribution.
The number can either be hardcoded or input into the cell reference containing the numerical value. For example, suppose the value is equal to 4.
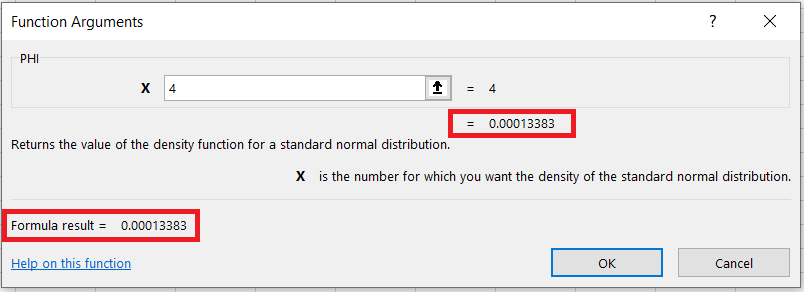
5. The preview we get for the result is equal to 0.00013383 in the dialog box. When you click on Ok, you get the same effect in the selected cell.
Method #2: As a worksheet formula
Using the function from the article can be quite tedious - you need to search for the position in different categories when unaware of what other parts do.
But that's just the beginning. Once you get the hang of it, you can directly use it as a worksheet formula. All you need to do is begin with an equal sign (=), type in the function name, and input the argument.
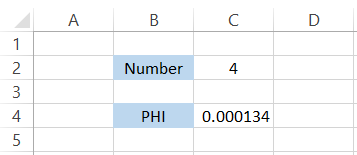
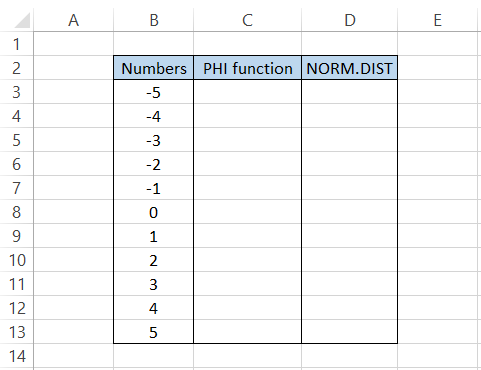
Suppose you have the number in Excel as illustrated below:
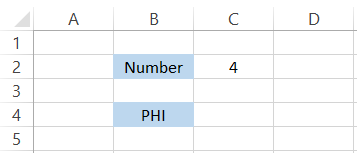
We will use the formula =PHI(C2) in cell C4, which gives us a result equal to 0.000134.
This way, you can calculate the density function for a standard normal distribution.
Example for the PHI function in Excel
We agree that the function has limited applications. To compensate for that, we will see how you can draw a standard normal distribution based on the values for the density function in Excel.
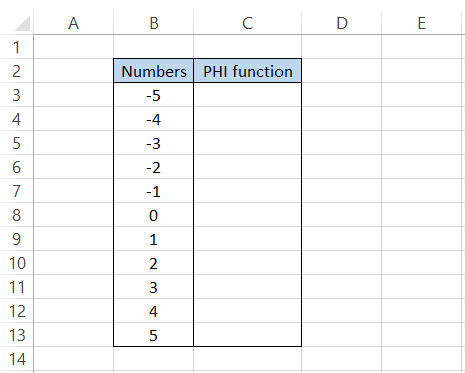
Remember that a standard normal distribution has a mean of 0 and a standard deviation of 1? Based on those assumptions, the numbers in Excel are as illustrated below:
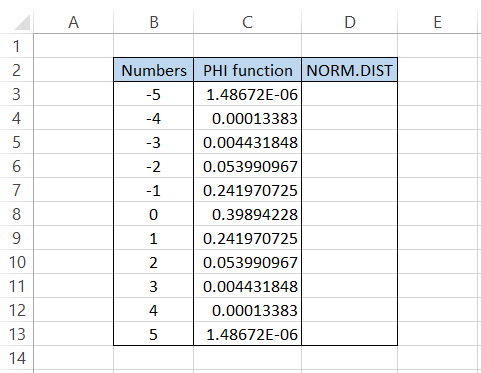
By using the formula in cell =PHI(B3) in cell C3 and dragging it down to cell C13, we get the result:
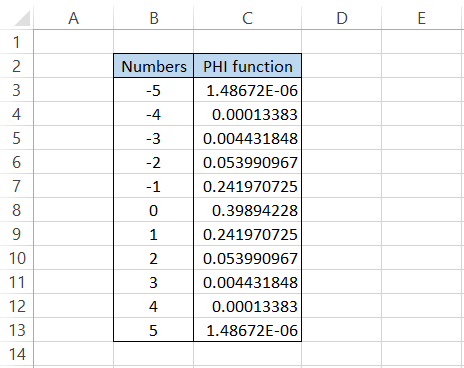
By observing the result, you would see that as we go nearer to zero, we get a maximum value for density function, while away from zero, the result keeps on decreasing towards zero.
It proves that the maximum number of observations is at the mean, which also becomes the mode of the standard normal distribution.
But the question remains - how do you draw the standard normal distribution based on our results?
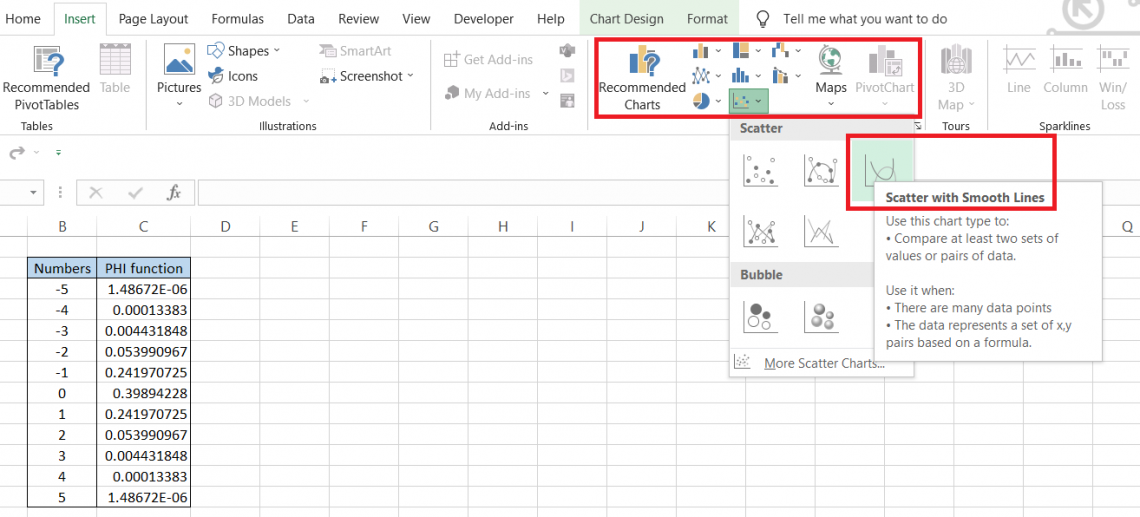
First, select the entire data present in your table.
Click on Insert > Charts Section > Scatter charts > select the option for ‘Scatter with Smooth Lines’.
This will display a default graph as illustrated below:
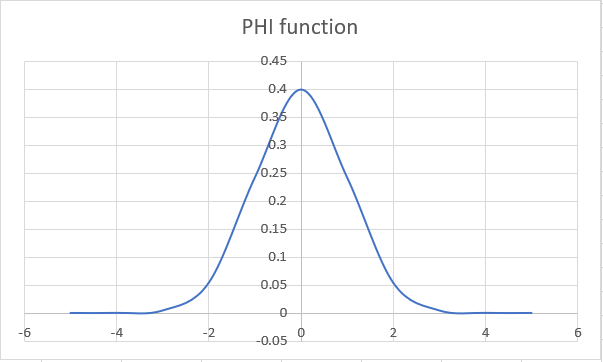
Then, after making the necessary customizations, such as adding titles for the axes, you get the final standard normal distribution graph, as illustrated below.

The numbers in the dataset don't necessarily need to differ by 1. The difference between them can also be more significant or less than 1.
NORM.DIST vs. PHI function
What is the similarity between the NORM?DIST and PHI function?
The NORM.DIST function allows you to calculate the normal probability density function when the mean and standard deviation are not equal to zero and one, respectively.
Conversely, the mean and deviation are equal to zero and one by default when you use the PHI function.
The calculation of the probability density function is one of the two roles NORM performs.DIST, whereas the other is the calculation of cumulative distribution function. Only the former is essential in this article since we want to calculate the density function.
The syntax for the function is:
=NORM.DIST(x, mean, standard_dev, cumulative)
where,
- x - (required) the input value for which we are calculating the distribution
- Mean - (required) the center value of the distribution
- standard_dev - (required) the standard deviation of the dataset
- cumulative - (required) a boolean value that determines whether the function will calculate the probability density function or the cumulative distribution function
If the value is equal to TRUE, then the function calculates the cumulative distribution function, whereas, for FALSE, the result is the probability density function.
Let's see an example of how the two functions correlate. Suppose you have the data as illustrated below:
To calculate the density function in column C, we will use the formula =PHI(B3) in cell C3 and drag it down to cell C13 which gives the result:
Similarly, we will calculate the probability density function using the NORM.DIST where the formula is:
=NORM.DIST(B3,0,1,FALSE)
This gives us the result as illustrated below:
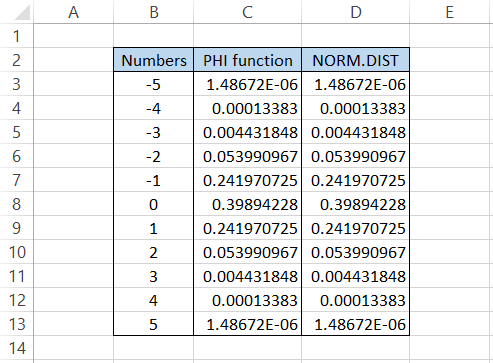
As you can see, we get the same results when you assume the mean equals zero and the standard deviation equals one in the NORM.DIST function.
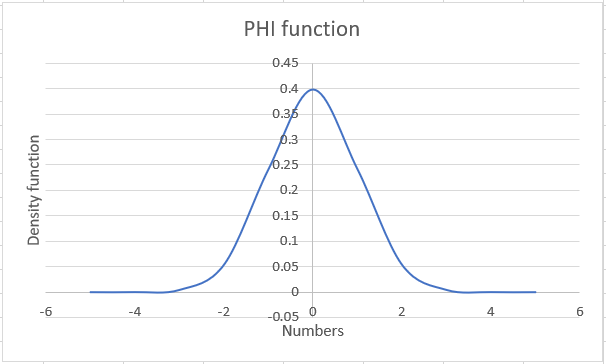
Both the results would have a similar graph as below:
Another example for NORM.DIST can be when the mean and standard deviation are not equal to zero and one, respectively.
Suppose you have the weights for the people where the mean is equal to 62, and the standard deviation is equal to 5.
You can find the first value in the series by the formula (Mean - 3 * Standard Deviation), which gives (62 - 3*5), i.e., 47, and take the count to 100.
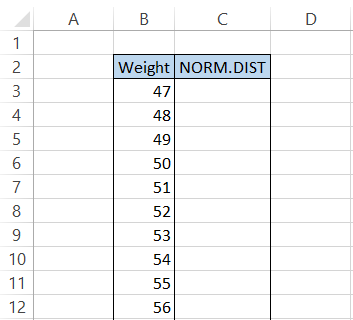
(Note: In the image above, the weight is filled till 78)
Next, we will use the formula =NORM.DIST(B3,62,5, FALSE) in cell C3 and drag it down to the last cell, which gives the result:
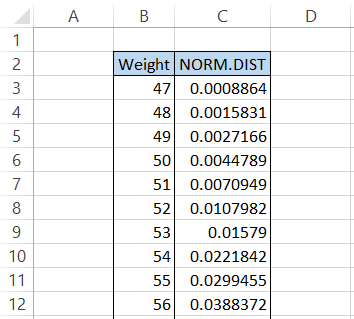
(Note: In the image above, the weight is filled till 78)
If you notice, you will find the NORM.DIST value to be the maximum near our mean value, which is 62.
The graph for the normal distribution using the density function values will be illustrated as:
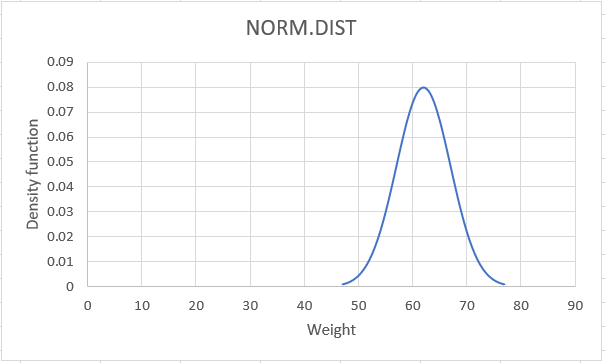
A bell-shaped curve is a great tool to evaluate the distribution of data. For example, here we can see that the maximum weight for the person is equal to 62. The right side of the curve indicates the people with higher weight while the left side indicates people with a lower weight.
The weight can further be converted into percentiles using the bell-shaped curve to compare against each other.
Key Points to Remember:
- As you go away from zero, the results you get for the density function would equal zero.
- If you input a non-numeric value, such as a text string or a boolean value, then you get a #VALUE! Error.
- An empty cell will be assumed to have the number argument equal to zero and give the result equal to 0.39894.


or Want to Sign up with your social account?