Engel’s Law
An economic theory that outlines the positive correlation between family income and the expenditures on a certain commodity or service.


What is Engel’s Law?
Engel's Law is an economic theory that outlines the link between family income and expenditures on a certain commodity or service. It claims that as a family's income rises, so does the percentage of money spent on food.
In 1857, German economist and statistician Ernst Engel proposed this law. The percentage of household income spent on food rises on a relative basis as household income rises, according to a 19th-century observation.
Ernst Engle is also known for the Engel curve in microeconomics, in addition to the law.
"The poorer a family, the greater the proportion of its total expenditure that must be devoted to the provision of food," wrote Ernst in the mid-nineteenth century.
This was eventually expanded to whole countries, with the argument that the wealthier a country is, the lower its food contribution.
The Merriam-Webster dictionary defines the rule as "a generalization in economics: such as family income increases, the percentage spent for food decreases, that spent for clothing, rent, heat, and light remains the same, while that spent for education, health, and recreation increases."
The law is still applicable today, even though it is more than 150 years old. The law is used to determine a country's economic well-being and population's level of life. The food portion of household expenditure, for example, is frequently used to estimate national poverty limits and rates.
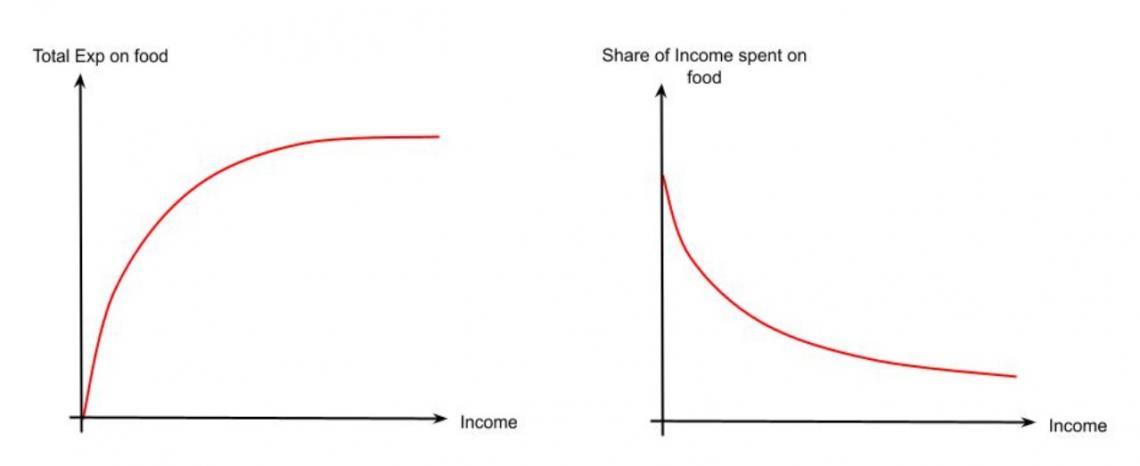
While the quality of food and the quantity spent on it improves as income rises, the overall proportion of the budget allocated to food spending decreases.
At the same time, having a larger salary allows a person to spend more money on things other than food. As one's income grows, so does their expenditure on secondary goods.
- This law was proposed by German economist Ernst Engel in 1857, it states that as household income rises, the proportion of income spent on food decreases, though total food spending increases.
- The law suggests that food demand has a positive income elasticity, meaning that as income rises, so does food expenditure, but at a slower rate than income growth.
- This graphical representation illustrates how household expenditure on a specific good or service changes with variations in household income, influenced by demographic factors like age, gender, and education.
- Engel's Law has significant implications for understanding consumer behavior, poverty levels, and economic well-being, informing policies related to income distribution, food security, and social welfare.
Understanding Engel's Law
According to the law, if a family's income rises, the proportion of that money spent on food drops, even though overall food spending rises. To put it another way, the income elasticity of food demand ranges from 0 to 1.
Or, when household income grows, the proportion of money spent on food decreases. As a result, lower-income households spend a greater proportion of their income on food to live.
The connection of household income to food consumption is well-established in today's popular economic ideas, especially with population health and enhancing the quality of life, a major rallying point for all developed economies.
The very poor may spend up to half of their income on food, indicating that their budgets are food-intensive or specialized.
Budget expenditures account for a large amount of a low-income family's entire budget, whereas the wealthy prefer to spend more of their money on items such as entertainment and luxury products.
Food expenditures account for a bigger portion of a low-income budget, which means that a low-income food intake is less diverse than that of more affluent customers.
Similarly, within the food budget, low-income individuals are more inclined to eat cheaper with more starchy items (such as rice, potatoes, and bread), resulting in less nutritious, less diverse diets.
For example A family with a monthly salary of $10,000 spends $4,000 on food, or 40% of their income ($4000/$10000). Let's say this family's income increased by 50% to $15,000 per year. They would spend roughly $6000 (40% of $15,000) on meals in this situation.
So, while the total amount spent on food would rise by 50%, the relative share would fall by 40% ($6000/$15000).
This illustration demonstrates the law, which states that lower-income families spend a greater percentage of their income on food than middle- and higher-income households.
To be precise, the law does not indicate that consumers' food spending remains unchanged as their income rises; rather, it says that consumers' food spending increases in percentage terms less than their income does.
Engel’s Law History
Ernst Engel discovered that home food spending and household income were correlated in 1857 using data from multiple families. The association between the proportion of household income spent on food was likewise quite stable.
For each obtained dataset, the income elasticity for food spending was inelastic, falling below 1, indicating that it is unaffected by price fluctuations.
Zimmerman claimed in 1932 that the law had been applied to elements other than income to food spending, which should not be the case.
He claims that it is obvious that the rule, as strictly understood, does not apply to specific families, times, or situations, and that the 'Engel' standard of living only applies to around half of the world's population.
The law had made its way over the Atlantic to Europe by 1875. There, it gained traction and was utilized by Carroll D. Wright, who argued that the law did not just apply to food expenses but also to clothes, housing, and sundries.
Personal preferences, family size, and cultural preferences, according to Zimmerman, are among the reasons for this.
It is now usual practice to examine how various types of expenditures develop in tandem with household income or total spending. There have been very few cross-national examinations of the relevance of the law in the twenty-first century.
In 2011, Richard Anker published a study that found convincing evidence that the law remains relevant today across countries as well as across households within countries. He also concluded that the law is only strong enough to predict differences in food shares of countries with large enough income per capita differences.
As a result, the law is a widely established economic connection that is frequently cited in academic publications' introductory parts.
What is the Engel Curve?
The curve is a notion that is based on Engel's law. This graph depicts how expenditures on a certain product fluctuate by percentage or absolute dollar amount.
The curve's form is determined by characteristics such as age, gender, educational level, and the sort of good it represents.
Moving along the curve presupposes that all of these variables remain constant, except for income, which is modified.
When demographic parameters change, the curve should move as well. Larger families will consume more food, and consumption expenditures shift during a life cycle, even when income and other demographic characteristics remain constant.
Food expenses as a percentage of total expenditures climb and then decline during a lifetime, forming an inverted parabola, demonstrating that both food and total expenditures peak in mid-life.
The curves demonstrate rising slopes for normal items with a positive income elasticity of demand, with income level as the x-axis and expenditures as the y-axis.
The curve is concave downward with a positive but decreasing slope in the case of food. Food, according to Engel, is a typical good, but the proportion of a household's budget spent on food decreases as income rises, making food a need.
The curve for goods having a unit income elasticity of demand goes through the origin in the graph, with income on the horizontal axis and consumption on the vertical.
The curve for a requirement with less than unit income elasticity is flatter, whereas the curve for luxury with more than unit income elasticity is steeper.
What is the Engel Coefficient?
The curves are a type of graph that shows how household expenditure on certain products and services is related to household income. They are used to quantify structural change, growth, international trade, and inflation in economic analysis.
Engel's Coefficient is used to establish national poverty levels and define a country's standard of living. It is used by the United Nations (UN) to measure and reduce poverty across the world.
In all of economics, the curve is one of the most extensively approximated and amazingly consistent empirical correlations. According to the law, lower-income households spend a greater proportion of their income on food than middle- and higher-income households.
It's worth noting that current research assumes a food income elasticity of less than 1.0 (but greater than 0.0), implying that the percentage of the family income spent on food falls as income rises.
Food consumption often accounts for a large amount of a low-income family's budget, whereas the wealthy prefer to spend more of their income on other products such as entertainment and luxury goods.
The idea may be applied on a national scale, demonstrating that industrialized nations with higher average household incomes spend a lower proportion of their income on food (as measured by the coefficient) than emerging countries with lower incomes.
It's derived by multiplying the percentage change in demand by the percentage change in consumer income.
Implications of Engel’s Law
An Engel curve illustrates how household expenditure on a certain commodity or service fluctuates with household income in microeconomics. Hence, it carries different importance, such as:
- Engel curves: Graphical representations illustrating how household expenditure on a specific commodity or service changes concerning household income in microeconomics.
- Lower-income allocation: The tendency for individuals with lower incomes to allocate a higher percentage of their earnings towards food expenditures compared to those with moderate or high incomes, as per Engel's Law.
- Price sensitivity: The increased sensitivity of lower-income individuals to fluctuations in food prices, leading them to allocate a larger proportion of their income to food-related expenses as prices rise.
The coefficient of a country shows its economic standing. A lowering coefficient typically suggests that the country's economy is growing and its income level is rising. A growing coefficient, on the other hand, suggests a reduction in a country's income level.
- Ongoing relevance: The continued exploration by economists of the relationship between food consumption patterns and income levels, highlighting the enduring relevance of Engel's Law in economic analysis.
- Dietary implications: Insights provided by Engel curves into people's dietary habits, informing discussions on healthy lifestyles and the availability of higher-quality food options.
Engel's Law Today
When comparing living conditions in different nations, the law can be used as a guide. The Engel coefficient, which is simply a food budget share at a given point in time, is used for this purpose.
A country with a lower level of life would have a higher coefficient, whereas one with a better quality of life would have a lower coefficient.
The United Nations (UN) uses a coefficient for this purpose, with a coefficient above the 59th percentile indicating poverty, 50-59% indicating a state where daily needs are barely met, 40-50% indicating a moderately well-off standard of living, 30-40% indicating a good standard of living, and below 30% indicating a wealthy life.
Engel's groundbreaking work laying the groundwork for extensive research on the connection between income and food consumption patterns, underscoring its lasting significance in economic theory and analysis.
The law has been used in a variety of economic studies examining the relationship between food intake and prosperity and well-being. Over time, it has been reevaluated and enhanced. Many economists continue to use it now.
Economists discovered that food consumption at home and away from home is compatible with the law, according to recent research. According to other research, the law might imply that lower-income households are more inclined to spend their money on less expensive, starchy items like rice, potatoes, and bread.
As a result, as money rises, the demand for higher-quality food rises with it. Using the law, researchers discovered that low-income households and countries are more affected by food price increases than wealthier families and countries.
The curve is a type of graph that shows how household expenditure on certain products and services is related to household income. They are used to quantify structural change, growth, international trade, and inflation in economic analysis.
Conclusion
Engel's Law is an economic hypothesis proposed by Ernst Engel, a German statistician, in 1857 that states that as income grows, the amount of revenue allotted for food purchases decreases.
It is an economic observation. It argues that as a family's income rises, the proportion of that money spent on food falls, even though total food expenditures rise.
According to the law, the income elasticity of food demand is positive but less than one. The income elasticity of demand is a measure of how sensitive a good's amount of demand is to changes in income.
Food expenditures are increasing at a slower rate than consumer income, resulting in a fall in percentage. The curve describes how the spending on a certain good varies with household income by either proportion or absolute dollar amount.
When a family's income rises, so do their food expenditures, indicating a positive link between consumer income and food demand. It implies that food has a positive income elasticity.
Demographic variables such as age, gender, and educational level, as well as other consumer characteristics, influence the form of the curve.
Engel classed products as superior or inferior to investigate the variance in consumption patterns of various types of commodities and, as a result, the variation in people's income levels.

Free Resources
To continue learning and advancing your career, check out these additional helpful WSO resources:


or Want to Sign up with your social account?