Market Structure
The competitive environment in which a business exists is influenced by firm size, entry & exit barriers, product differentiation, and pricing power.


What is Market Structure?
Market structure is defined as the competitive environment in which a business exists, which is affected by the size of the firms, barriers to entry & exit, product differentiation, and pricing power.
In simple terms, a market is any platform where buyers acquire what they want by exchanging goods, services, or any other item equivalent in value to the products they wish to purchase.
When you think of a market, you usually paint a picture where dozens of sellers have set up their stalls, and buyers flock to these stalls to purchase goods.
However, with globalization, markets have evolved significantly. You can buy anything from the comfort of your home! Markets are everywhere and even for the exchange of information.
The very meaning of a market changes when we observe it from the perspective of an individual customer and a company.
For a buyer, a market is a platform where he can acquire what he desires by offering something of an equivalent value. However, for a seller, it is the range of customers he caters to across all geographic regions.
For a firm to be able to answer the following questions, knowledge of market structure is necessary.
- Is our demand curve elastic or inelastic? What would be the impact on our revenue if we alter our prices?
- Is the market we operate in highly competitive? Who are our major competitors?
- Is there a price leader? In other words, will all other firms follow this entity if they change their prices?
The major market structures are
- Perfect competition
- Monopoly
- Monopolistic competition
- Oligopoly
We will be looking at each of these structures in detail. But before we begin exploring them, I must introduce a few concepts. These concepts are essential to understanding each market form’s price determination process.
- Market structure refers to the organizational and other characteristics of a market that influence the nature of competition and pricing.
- It describes the competitive environment in which firms operate and can impact economic outcomes such as pricing, production, and efficiency.
- Perfect Competition is a market structure characterized by many small firms, homogeneous products, and easy entry and exit. No single firm can influence the market price.
- A monopoly is a single firm that controls the entire market. This firm sets prices and output levels without competition, often leading to higher prices and lower output than in competitive markets.
Market structure: What is total, marginal, and average revenue?
Understanding the idea behind total, marginal, and average revenue is not so difficult. Most of us probably apply this in our day-to-day purchases. The only difference is that we see these concepts from the “cost” spectrum.
The total revenue earned by an entity is simply the product of the number of units it sells and the price it charges per unit. From the cost perspective, the total cost is the product of the number of units you purchase and the price you pay per unit.
For example, if a firm sells 100,000 units of a product in a financial year and charges its buyers $20 for each unit, it has earned a total revenue of $2 million that year.
The average revenue (AR) is the quotient of the total revenue earned by a firm during a period and the number of units it has sold. In the above example, the firm has made an average revenue of $20 per unit.
Finally, the marginal revenue (MR) is the revenue earned by selling one additional unit. For example, if the firm makes a revenue of $8000 by selling 800 units and a revenue of $8300 by selling 801 units, its marginal revenue is $300.
Can marginal revenue be negative? Absolutely. Take a look at this.
Total revenue by selling 100 units 300
Total revenue by selling 200 units 260
We can see that the marginal revenue has fallen by $40.
Conversely, a negative marginal revenue implies that total revenue is falling.
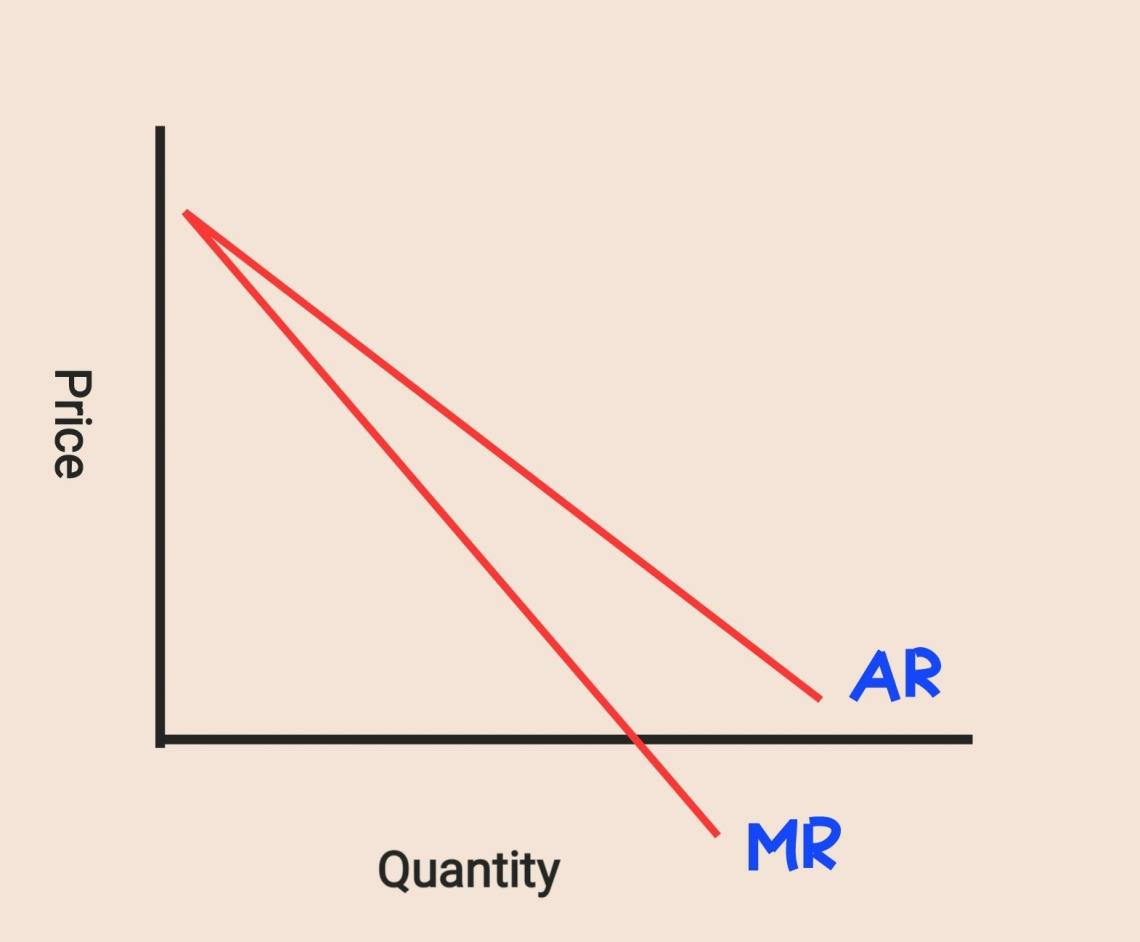
Another principle is that the marginal revenue curve is always steeper than the average revenue curve. Again, the reasoning is that a change in average revenue is spread out across all units, whereas the marginal revenue curve is focused on per-unit change.
Both the MR and AR curves are representative of the demand curve. This is because the demand curve follows the law of demand. According to the law of demand, all factors remain constant. Therefore, there is an inverse relationship between price and demand. For example, look at the diagram below.
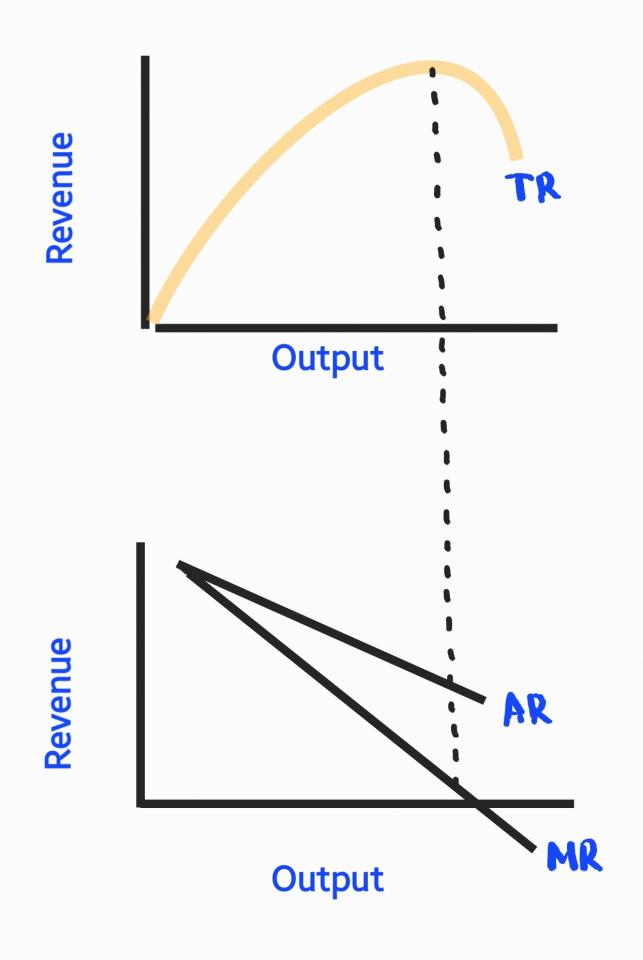
We can see that the total revenue curve begins to fall right when the MR curve becomes negative. The total revenue is maximum when the marginal revenue is zero.
Beyond this point, the firm will not earn additional revenue by selling more units. Furthermore, the average revenue curve cannot be negative (because it is impossible to charge a negative price for the product!).
Market equilibrium and determination of prices
I mentioned we would be studying price determination under different market scenarios. But, before that, let us give a general price determination overview. By now, you know that the price of a commodity is affected by demand and supply.
Have you ever gone to your local grocery store or an e-commerce website and been frustrated because your favorite item is “out of stock”? Or, have you started a business but were left with a lot of unsold stock?
We constantly come across demand-supply imbalances. Market equilibrium is when all demand is met and all stock is sold. There is parity between demand and supply.
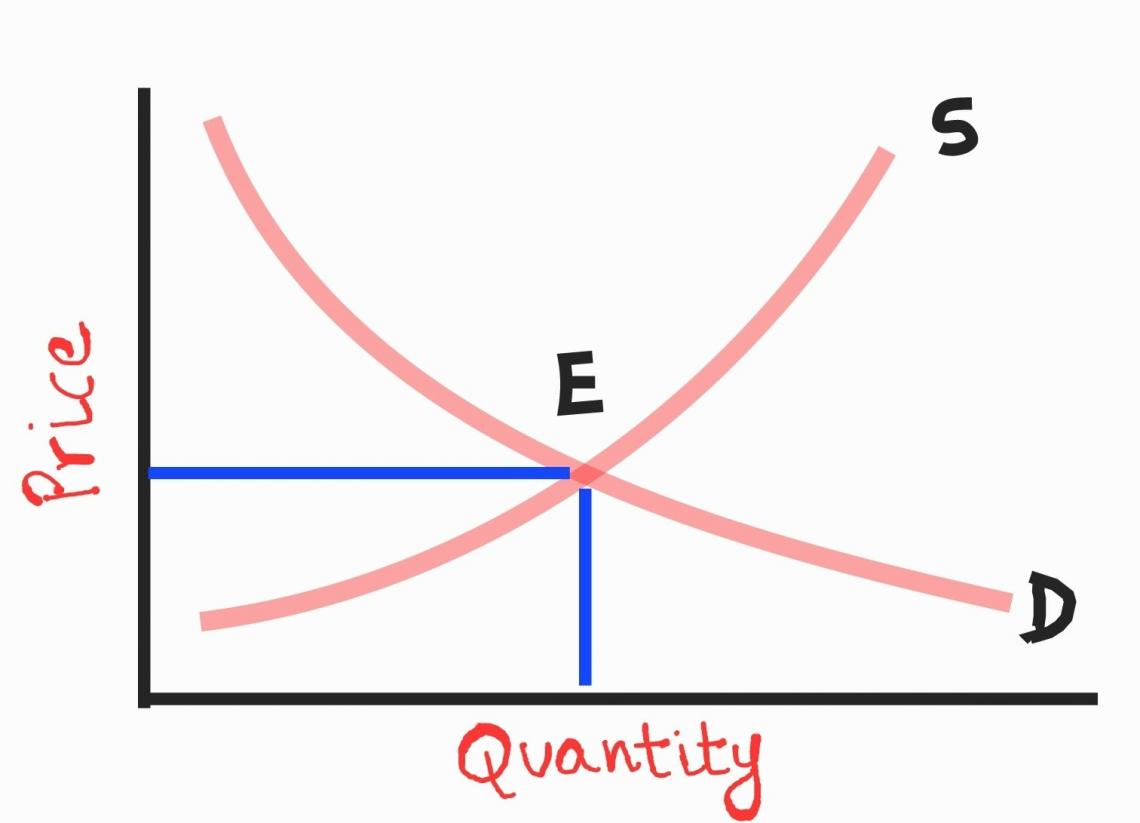
The figure below illustrates market equilibrium.

At point E, the market achieves equilibrium. This is the point at which demand equals supply. Notice that supply (S) keeps increasing as price increases and demand (D) keeps declining.
The firm would want to reduce the supply of commodities whose prices are falling as such commodities are deemed unprofitable. But, at the same time, customers would like to purchase more of these commodities to take advantage of reduced prices.
Therefore, below point “E,” demand is more than supply. Since many buyers cannot procure what they desire, they are willing to pay more to satisfy their needs. Therefore, we know that an increase in price causes an increase in supply.
Therefore, production increases, demand is met, and equilibrium is restored.
Above point “E,” supply is more than demand. Producers are left with a lot of unsold stock. To increase sales, they reduce prices. A price reduction will increase demand and restore equilibrium.
Now that we’ve covered these concepts let us explore the different market structures and how they operate.


Market Structure: Perfect competition
To understand perfect competition, let us take two situations you might experience. First, you walk into a car dealership to buy your first car. The approach would be to thoroughly examine all the different brands and models and shortlist the best ones.
Once you’ve selected your vehicle, you begin price negotiations with the salesman. If you’re uncomfortable with the price offered, you could walk away and approach another dealership.
Do you do the same while you purchase groceries? No. This is because you know that market prices for items such as milk, eggs, and bread are standardized in your area. Therefore, you would only negotiate a little.
This differentiator is what constitutes perfect competition. However, there are some features unique to this market structure.
- The products you see on the shelves are homogeneous, i.e., hardly any differentiating factor. However, in the case of a car, companies could use many elements, such as design, performance, etc., to gain a competitive advantage.
- No single buyer or seller has complete control over the market. The number of players is so large that a single entity cannot influence the operation of the entire market.
- There is absolutely no room for a price war. This is because there is no price leader. Furthermore, because of homogeneity in products, buyers can switch to a competitor’s product if they are unsatisfied with the price.
- Since no single entity controls the market, it naturally follows that no firm can place entry barriers over the market. Players are free to enter and exit as they desire.
Now that we know what perfect competition means let us look at the price determination scenario under perfect competition.
Price Determination in a Perfectly Competitive Market
We can explore the idea of price determination under any market structure from two spectrums - the firm’s and the industry’s equilibrium.
In the previous section, we discussed the equilibrium of the industry, which is achieved when demand equals supply.
Determining the equilibrium of a firm is a slightly different ball game. The firm’s equilibrium is the point at which it has maximized its profit. Notice that I used the term “profit” and not “revenue.” We need to account for costs too.
We know that businesses in a perfectly competitive market cannot be price leaders. They need to sell their products at a price determined by the market, i.e., the equilibrium price. At this price, they can sell any number of units.
If they sell above the equilibrium price, they will lose customers. But, on the other hand, it does not make sense to operate below the equilibrium price as the firm will lose revenue.
Take a hypothetical example of a firm that sells bread. The market price for bread is $5 per kg. This is the equilibrium price, i.e., the price at which all firms have to sell bread.
We can map an output-revenue chart for this firm under different output conditions.
| Cost per kg ($) | Output assumption (kgs) | Total revenue | Average revenue | Marginal revenue |
|---|---|---|---|---|
| 5 | 7 | 35 | 5 | 5 |
| 5 | 8 | 40 | 5 | 5 |
| 5 | 9 | 45 | 5 | 5 |
| 5 | 11 | 55 | 5 | 5 |
Notice that the average and marginal revenue remain constant irrespective of output and are equal to the price. Observe the figure below.
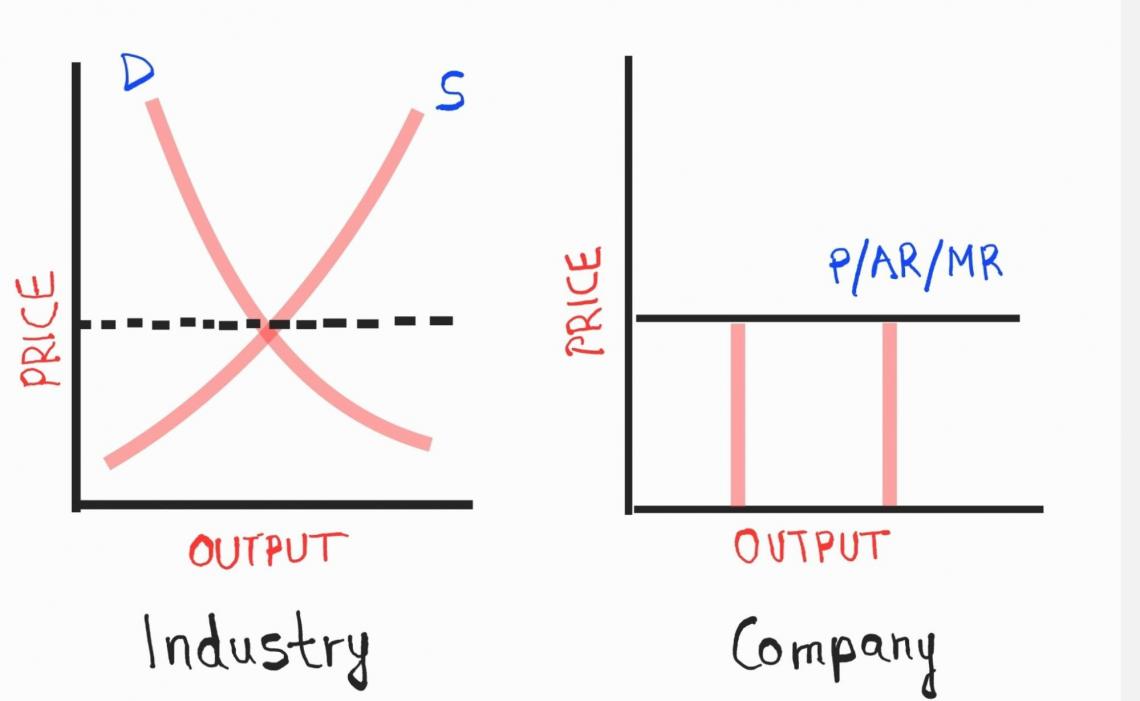
We can see that the price determined by the industry is the price followed by individual businesses. This is because the price/AR curve/MR curve is also the firm’s demand curve. The demand curve happens to be perfectly inelastic.
This means that the demand will be unaffected by a change in price, and the firm can sell any number of units it wishes to.
For a moment, let us talk about marginal cost. First, the marginal cost keeps declining as the firm generates more output due to economies of scale. Then, after a point, the marginal cost begins to increase due to diseconomies of scale.
As we proceed, you will understand why I spoke about marginal cost. A company in a perfectly competitive market must satisfy two conditions to achieve equilibrium.
- The marginal revenue must equal the marginal cost. If MR>MC, the firm must produce more. If MR<MC, the firm is incurring losses and must stop production.
- We can see from the figure below that MR = MC at two points. The equilibrium point is the point at which MC cuts MR and begins to rise.
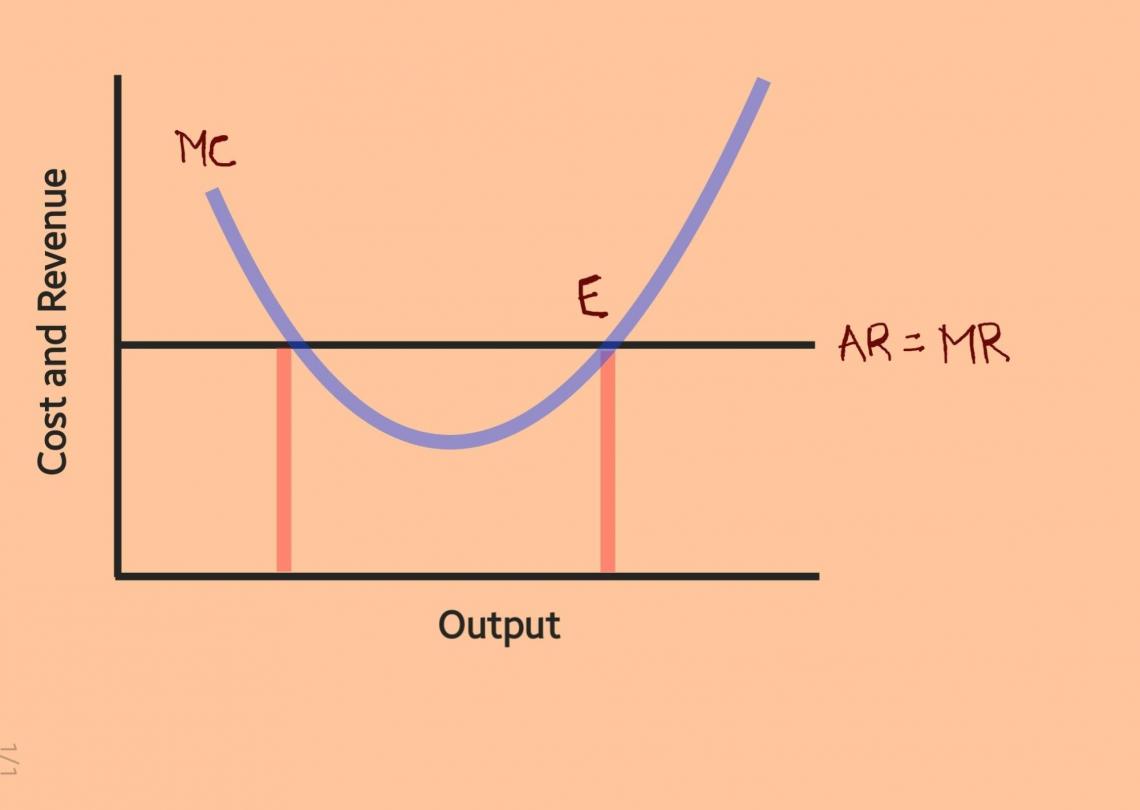
At the first output point, MC = MR, but since the cost is falling, the firm must produce more. If the firm goes beyond point “E,” it will incur losses since the cost rises. Point “E” is the point at which the firm attains equilibrium.
Market Structure: Monopoly
This is a market structure that we would rarely come across today. It is a market where a single seller has complete control over the product. As a result, no other player sells the product, or the sales of the other players are insignificant.
In short, the seller with the largest market share is the king.
Like a perfectly competitive market, a monopoly has a few distinguishable features.
- Only one entity controls the supply of the product. What does this mean? Do you remember how we said that perfectly competitive firms follow the industry and do not have any individual power? In a monopoly, since all control is with one entity, there is no difference between a firm and an industry.
- The firm that controls the market does so because it has established strong barriers that other firms cannot penetrate. We will explore what these entry barriers are in just a moment.
- While perfectly competitive firms accept the market’s price, monopolistic firms are free to adjust their prices.
Let us now explore ways businesses create a strategic advantage that leads to a monopoly.
- Some monopolies have access to precious resources. These resources are in short supply, and having control over such resources enables these firms to control market supply.
- It is not necessary that the firm artificially create entry barriers. Businesses that have improved their production activities and expanded their operations benefit from economies of scale.
- At times, the product or service in question may be hazardous. As such, there might be legal restrictions against mass production, and the authorities assign a single entity complete control.
- A group of businesses may form a conglomerate and use their resources to prevent further competition. New entrants would find it difficult to establish a business in such an environment.
- Some businesses have been in the market for so long that they continue to enjoy complete control solely due to their goodwill over the years.
Price Determination in a Monopoly Market
In a monopoly market, there is no distinction between the business and the industry. Since one entity controls the market, we can map its demand curve exactly how we do so for an industry.
At different price points, the monopolist firm will see different demand levels. The price charged is the average revenue, i.e., the revenue per unit. Therefore, we can say that the average revenue curve represents the price and demand curve.
Although a monopolist enjoys complete control, he cannot charge any price he wishes. Often, regulators cap the price he can charge. But even if there are no restrictions on price, customers will not be willing to purchase beyond a price point.
Therefore, a firm in a monopoly market faces a downward-sloping demand curve.
How does a firm in a monopoly attain equilibrium? Perfectly competitive firms accept the market price. They do not have any restrictions on production and can sell any units at the market price.
In a monopolistic market, the seller must reduce the price to increase sales as the demand curve slopes downward. To attain equilibrium, the monopolist must find the combination of price and output that maximizes profits.
The equilibrium conditions for a monopolistic firm are similar to those of a perfectly competitive firm.
- The marginal revenue must equal the marginal cost. If MR>MC, the firm must produce more. If MR<MC, the firm is incurring losses and must stop production.
- We can see from the figure below that MR = MC at two points. The equilibrium point is the point at which MC cuts MR and begins to rise.
The average cost and marginal cost curves are similar across all market structures. The marginal cost curve initially declines due to economies of scale but later rises due to diseconomies of scale.
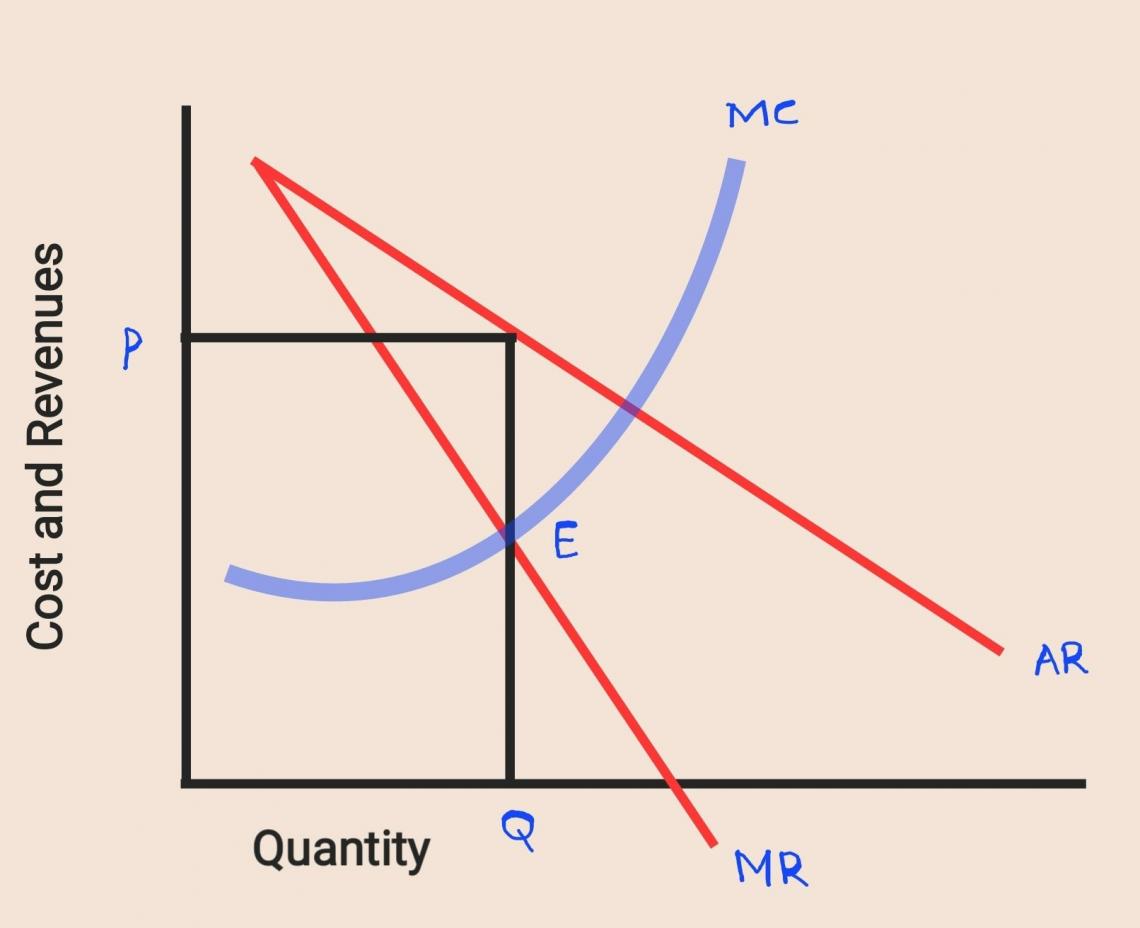
First, the marginal revenue curve intersects the marginal cost curve at point “E.” This is the profit maximization point. Second, “EQ” is the equilibrium quantity. Finally, we get the equilibrium price when we extend this point to the demand curve.

Market Structure: Monopolistic competition
Let us journey back to the concept of perfect competition. First, we learned that since all the products are homogeneous, the buyer can switch to a competitor’s offering. But, realistically, perfect competition is only a theoretical concept.
Take the example of milk. On the surface, it seems that milk is a homogeneous product. After all, how much can you differentiate milk?
However, businesses have developed many innovative offerings to differentiate themselves from their competitors. Such competition has led to the production of skim milk, organic milk, lactose-free milk, raw milk, and tons of other variants.
Price wars are seldom healthy. While businesses in a perfectly competitive market engage in price wars, a monopolistic competition environment is one where sellers attempt to make their products stand out.
This differentiating factor is why the market structure has been termed “monopolistic” competition. It is an amalgamation of both perfect competition and monopoly.
Let us look at some of the features of monopolistic competition.
- A perfectly competitive firm’s demand curve is elastic because the products are perfect substitutes. However, products in monopolistic competition are close substitutes, i.e., they have differentiating factors.
- Like the perfect competition, there are hardly any barriers to entry and exit. New players come and go as they please.
- The firm gains a competitive advantage through innovation rather than price wars.
Price Determination under Monopolistic Competition
We established that monopolistic competition shows a relatively elastic demand curve because of product differentiation and close substitutes.
The demand curve’s steepness measures the demand elasticity: the flatter the curve, the more elastic the demand.
The elasticity of demand measures the magnitude of change in demand due to a price change. The more elastic the demand, the more the market responds to a change in price.
In a monopolistic competition scenario, the degree of differentiation will determine the elasticity of demand. Therefore, the more the product is differentiated, the greater the competitive advantage and the steeper the demand curve.
It is important to note that firms under monopolistic competition cannot earn supernormal profits. Normal profit is a scenario where revenues are only sufficient to meet costs.
The reasoning is that many other firms would want to enter the industry if businesses generate revenues over and above their costs. Due to increasing competition, profits begin to fall, and the firm earns a normal profit.
Conversely, if enterprises incur losses, many players exit, and the market returns to earning normal profits.
The equilibrium of a firm in monopolistic competition is achieved by maximizing profits. Yet again, the conditions for equilibrium are the same as seen in the previous market structures.
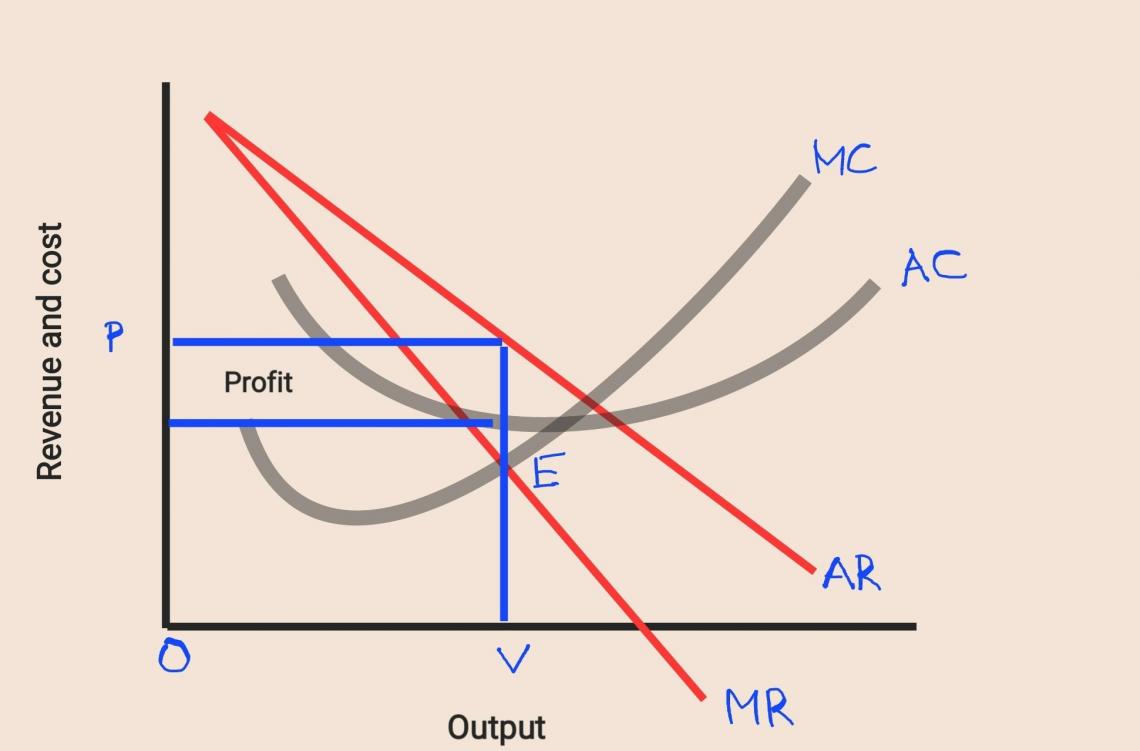
We can see that the equilibrium point, i.e., the point at which the MR curve cuts the MC curve, is “E.” EV is the target output, and OP is the target price at which the firm operates.
Notice that the profit, i.e., the area from point “P” to point “E,” is the difference between the average revenue and average cost.
Remember how we said the marginal revenue curve is bound to fall and rise faster than the average revenue curve? This is because a change in the cost of producing one unit is more significant than the change in total per unit cost.
Therefore, when the cost curves are falling (due to economies of scale), the marginal cost curve falls faster and is below the average cost curve. Conversely, when the cost curves increase, the MC curve lies above the AC curve.
Market Structure: Oligopoly
Let us explore the final market structure, i.e., oligopoly. An oligopoly is a more realistic market structure. We could describe oligopoly as a variation of monopoly.
In monopoly, we saw how a few market leaders firms form a conglomerate to create entry barriers for new entrants. Such a congregation is known as an oligopoly.
The oligopolistic approach has a few features. These are discussed below.
- There are very few firms that collectively control the market. These firms create entry barriers on the strength of their market share.
- Unlike perfect competition, where no individual firm can affect the market’s performance, each player in an oligopoly can exercise influence over the market. Any move by one business will face similar retaliation from all other businesses.
- Like under monopolistic competition, players in an oligopoly actively avoid price wars. They compete through product differentiation and innovative ventures.
- Usually, firms that form a conglomerate appoint a leader. This leader guides the group’s actions and helps provide an operational framework. All businesses draft their policies by considering the movements of the leader.
We will conclude by looking at the price determination and equilibrium scenario under an oligopolistic market.
Price Determination in an Oligopolistic Market
It is neither possible nor feasible for businesses in an oligopolistic environment to engage in price wars. As soon as competitors notice that a rival firm has altered its prices, they would also bring their prices down.
A unique feature of oligopoly is that it is challenging to create a demand curve for an individual firm because of rival responses. However, many strategies have been developed for price determination through experiential learning.
As discussed, one of the most common approaches is appointing a price leader. The price leader looks at industry trends and determines a price-output range to maximize profits. The other firms simply follow.
Sometimes, the businesses jointly agree to work in tandem and form an organization that serves the interests of all its members. As a result, all benefits arising from the conglomeration are shared equally or as agreed.
The most common example of such a conglomeration is the Organization of the Petroleum Exporting Countries (OPEC).
The final approach is to ignore the collusion and act as independent entities completely. Each firm is responsible for its costs, profits, and losses. We can then draw up a demand curve for each firm.
Paul M. Sweezy developed a theory depicting an oligopolistic firm’s demand curve. He opined that the demand curve of an oligopolistic firm is kinked, as shown below.
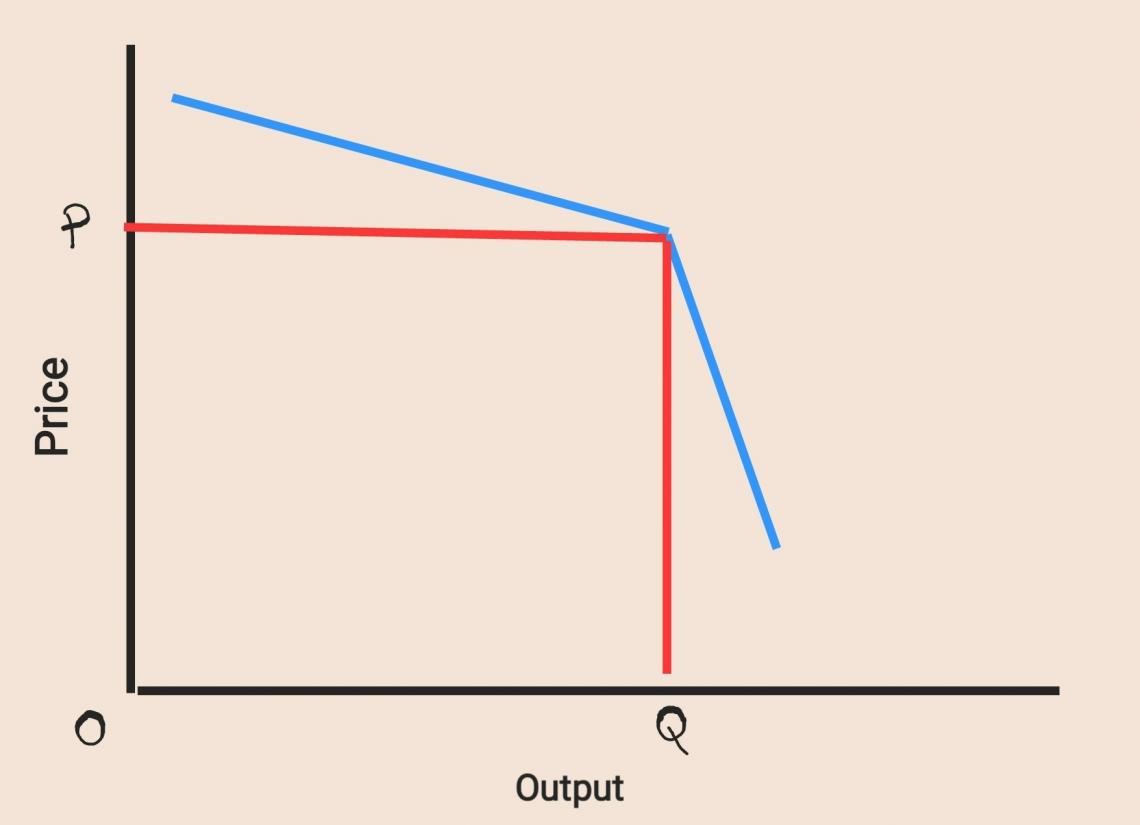
Notice that the demand curve becomes steeper after a point. This price point is the price that is predominant in the market. Below this point, demand is relatively inelastic, i.e., it does not respond much to price changes.


Free Resources
To continue learning and advancing your career, check out these additional helpful WSO resources:


or Want to Sign up with your social account?