NAIRU
A theoretical level of unemployment below which inflation is expected to rise.


What Is the Non-Accelerating Inflation Rate of Unemployment (NAIRU)?
NAIRU stands for a non-accelerating inflation rate of unemployment, introduced in 1975 as NIRU- the non-inflationary rate by Franco Modigliani and Lucas Papademos.
It is a theoretical level of unemployment below which inflation is expected to rise. It is an improvement over the natural unemployment rate, which Milton Friedman gave.
According to the theory, as unemployment rises, inflation should decrease. This is because inflation tends to fall when businesses fail to increase prices due to a lack of consumer demand in a poorly performing economy.
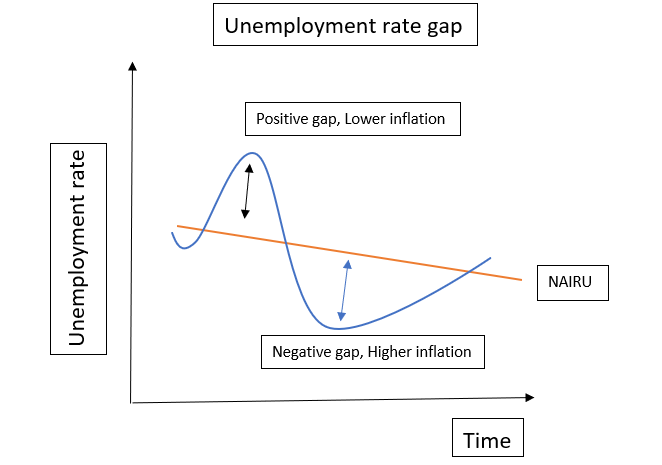
It is the unemployment level that the economy must reach before a fall in the price level occurs. However, inflation should increase if unemployment falls below this level due to a strong economy as companies raise prices to match demand.
It is a concept that helps one to measure the "spare capacity" in an economy. Spare capacity refers to when aggregate demand for goods and services is less than the production capacity of an economy.
As spare capacity decreases, finding workers becomes more challenging for businesses. As a result, higher wages are offered to retain and attract workers, increasing the price of goods and services and thereby increasing inflation.
- NAIRU is the level of unemployment at which inflation remains stable. It represents the lowest unemployment rate an economy can sustain without causing inflation to increase.
- NAIRU is the non-accelerating inflation rate of unemployment. It suggests that when unemployment is below this rate, it leads to wage increases and inflation, and when unemployment is above this rate, inflationary pressures are subdued.
- NAIRU reflects a balance where the economy is at full employment without exerting upward or downward pressure on inflation. It is a theoretical concept used to guide monetary and fiscal policy.
- NAIRU is difficult to measure and focusing solely on it may neglect other important factors like wage inequality and labor market dynamics.
How NAIRU Works
Though direct measurement is impossible, spare capacity can be observed as the difference between NAIRU and the unemployment rate. An economy is said to work at total capacity when the unemployment rate equals NAIRU.
If U* is the non-accelerating inflation rate of unemployment and U is the actual unemployment rate, the theory suggests:
- If U < U*, the rise in inflationary expectations leads to an increase in the inflation rate
- If U > U*, the fall in inflationary expectations leads to a slow inflation rate or disinflation
- If U = U*, the inflation rate stays the same unless there is an exogenous shock
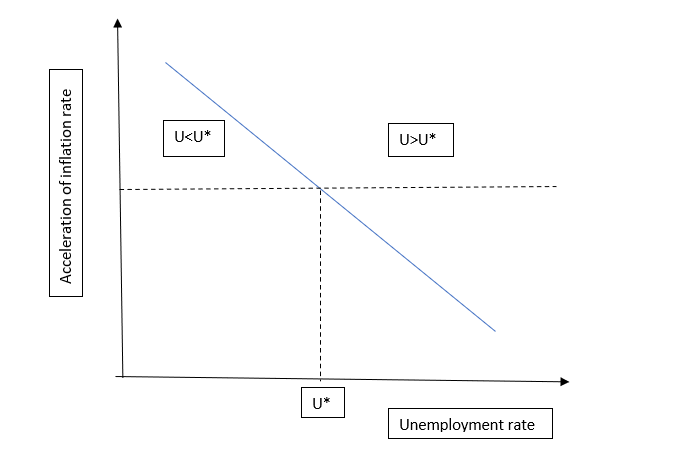
The Phillips curve highlighted his concept of employment, showing the relationship between unemployment and inflation rates. This curve establishes a negative correlation between the two.
The diagonal line in the diagram above represents the Phillips curve, where = -(u - u*) + v. The acceleration or deceleration of inflation is examined, discarding the shock value v and making an assumption on expectations.
Critics of the Phillips curve observed it has little to no theoretical basis, as many parts of the world during the 1970s saw a simultaneous rise in inflation and unemployment. Counter-analysis was given, emphasizing the role of monetary policy.
According to conventional macroeconomic theory, the trade-off between inflation and unemployment is critical to understand, as it affects monetary policy and events that influence the aggregate demand for goods and services.
Note
NAIRU differs from the natural rate of unemployment
The natural rate is the minimum rate resulting from actual or economic forces and reflects the number of people not working due to the structure of the labor force. Instead, NAIRU has to do with the relationship between unemployment and inflation.
NAIRU Determinants
It is assumed to fluctuate and is influenced by various factors that affect productivity, demographics, and public policies. A few of them are:
- Globalization: There is increased competition for domestic businesses due to the increased supply of overseas goods and services. However, this discourages businesses from raising prices, even in the event of low unemployment, as consumers can switch to overseas suppliers.
- These highly integrated economies, therefore, have a lower unemployment rate at which
- Government training and skills program: These programs ensure necessary skills are developed within a population to fill jobs. As a result, these efforts increase the pool of workers available to fill positions.
- Ease of finding suitable work: Technological progress has made it easy for workers to find a job and employers to find a worker. As a result, less time is spent on the process of searching. This has increased the number of workers who can be productively employed.
- Employee bargaining power: Wage growth is affected by the bargaining power of workers. A lower bargaining power, which is a result of lower union membership, for example, reduces the ability of workers to demand higher wages.
- Underemployment: The underemployed is the share of workers willing and able to work more hours but aren’t scheduled. Elevation of underemployment may increase the position or number of hours worked by existing employees to meet higher demand instead of hiring new employees.
- This both increases employee satisfaction and avoids the costs of hiring and training new workers.
- Long-term unemployment: Large unemployment and/or recessions can decrease an economy’s overall physical capital as some, for example, choose to skip education to work. Even after the economy recovers, NAIRU can be permanently affected.
- A result existing after the cause has been removed is known as hysteresis.
Hysteresis in NAIRU
The notion of hysteresis complicates the interpretation of changes in NAIRU.
This long-term effect can occur for various reasons, including the erosion of human skills due to the insider-outsider phenomenon and the screening device phenomenon.
The insider-outsider phenomenon occurs when those already employed by a company have the incentive to try and raise their wage instead of maintaining the same salary and allowing others to join the firm.
The firm has the same incentive due to the high costs of hiring and training a new worker to replace someone who quit due to a lack of wage negotiation.
The screening device phenomenon suggests that the unemployed are viewed as unemployable, making it harder for them to find jobs.
The interpretation of changes in NAIRU must be exemplary, as the estimates are unreliable. For example, it has increased in countries where the unemployment rate has also significantly improved.
The hysteresis view came into the picture due to the difficulty in identifying the specific changes in the supply-side determinants, like prices and wages, causing modifications to NAIRU.
Instead, economists now look back to see factors in the past that may be resolved but still have an effect.
There are two types.
Pure Hysteresis
This implies that equilibrium underemployment is wholly unaffected by actual unemployment. Instead, one should focus on the unique level of equilibrium unemployment.
The concept is useless as a macro policy tool since its level does not affect wages and price development.
Partial Hysteresis
This disequilibrium phenomenon explains a long-term rise or fall in unemployment due to a slow adjustment process.
Here, unemployment persistence leads to a long-run equilibrium level being below the previous one for an extended period following a disturbance.
This persistence will gradually be removed over time through the slow adjustment of real wages and employment, ultimately restoring the equilibrium in the labor market.
These speed limits reflect the relatively weak impact of the long-term unemployed on wage formation and prevent the outbreak of inflationary pressure on the growth of an economy.
The Layard-Nickell model
This model comes from the article "Unemployment in Britain" written by Richard Layard and Stephen Nickell in 1986 as a reply to the theories of New-Keynesian economics and neoclassical synthesis Phillips curve.
The model was established to explain why economists should move away from the perfectly competitive labor market assumption toward a model based on wage determinations with the help of trade union bargaining.
Trade unions bargain with employers to get higher wages for workers. It implies that, as more people are employed and represented as a part of a trade union, higher wages will be paid. It is represented by the BRW (Bargained Real Wages) curve.
Once bargaining is done, the employer fixes the price (P) according to the cost of production and markups (), assuming real wages (W) as the only cost of production. MPL represents marginal productivity.
P = (1 + μ) * (W/ MPL)
m = μ/ (1 + μ)
W/P = MPL * (1 - m)
W/P represents price-determined Real wages, PRW. Markup and marginal productivity remain the same throughout.
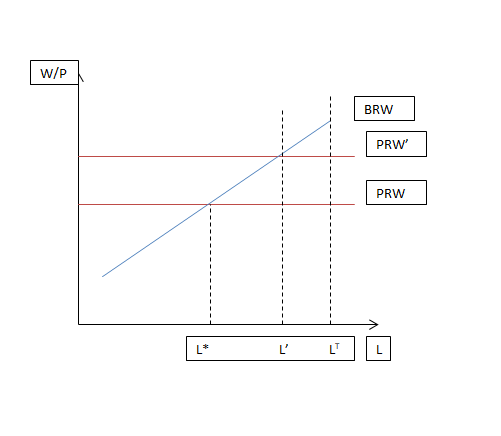
The distance between the level of employment at equilibrium (L*) and the total labor force (LT) in an economy is the non-accelerating inflation rate of unemployment.
Since employers will not willingly accept a decrease in profit, they will maintain a markup, which results in a price rise. Therefore, an increase in employment will increase the aggregate price levels.
It was concluded that anything affecting wage formation or the unemployment rate would affect inflation. Fixing a salary above the one in the competitive labor market will increase prices, increase inflation, and reduce real wages.
Shifting Dynamics of NAIRU
It changes because of changes in the labor force and economy. In the second half of 1990, the advent of a new economy with higher productivity growth, new technology, and increased competitiveness was observed.
Some examples of this were as follows.
Greater Openness to Trade
A favorable shift in the Phillips curve was observed due to globalization in the US economy. As a result, the ratio of imports and exports to gross domestic product has increased in recent decades.
Greater competition due to higher integration turned out to be anti-inflationary. Moreover, in the presence of low unemployment, firms could not raise the prices as consumers were expected to switch to foreign suppliers.
Better Job Matching
The process of workers moving from jobs that disappear to ones that open up creates unemployment, as workers take time to find jobs. This improved in the 1990s, which led to lower unemployment in the economy.
The most common example focused on the growth in the temporary help industry, where the percentage of workers employed doubled from 1.1% in 1989 to 2.2% in 1998.
This suggested an increase in the number of workers taking up temporary jobs while switching from permanent jobs rather than unemployed. In addition, these temporary agencies sped up the process of permanent job matching.
The Productivity Acceleration
The central feature of the new economy was a rise in the growth rate of labor productivity. The annual growth rate in output per hour increased from 1.5% in 1974-1995 to 2.6% in 1996-2000.
Economists established a link between the increase in productivity due to the use of computers and the Internet and the wage aspirations of workers.
In a steady-state economy, the growth of real wages is determined by the development of productivity. In such circumstances, workers view the increase in real wages as fair and expect it to continue.
Many journalists cited that inflation failed to accelerate even though low unemployment prevailed. This is due to productivity acceleration, which reduced firms' costs and offset the rapid wage growth. As the overall costs remained the same, inflation did not rise.
The Beveridge Curve
Blanchard and Diamond (1989) emphasized the Beveridge curve while analyzing the labor market. It showed the relationship between the workers without jobs and vacancies in the market.
The slope of the curve was downwards in the unemployment-vacancy space and would shift over time. An economic expansion that reduces the number of workers without jobs also increases the vacancies, as firms face difficulty finding workers in a tight market.
Improvement in job matching technology shifts the curve and is informative about movements in NAIRU (a fall in the rate).


Free Resources
To continue learning and advancing your career, check out these additional helpful WSO resources:


or Want to Sign up with your social account?