Big Mac Index
A price index that measures the purchasing power parity between two currencies


What Is The Big Mac Index?
The Big Mac Index (BMIX) is an effective way to measure and get a good sense of the purchasing power parity (PPP) of different countries by comparing the price of a Big Mac Burger in different countries.
The Economist developed this index in 1986; since then, it has become a popular economic indicator of the cost of living.
The fundamental part of the BMIX is based on the PPP theory, which signifies that things or commodities cost the same in different countries if adjusted to the PPP.
For example, if a Big Mac burger costs $5 in the US and an equivalent of $6 in Japan, the Japanese currency is worth more than the USD.
Here, the PPP theory says that the value of Japanese currency should decrease (or USD must appreciate) so that the price of a Big Mac burger becomes the same as in the US.
The PPP theory also says that in the long run, people from different countries can purchase the same thing at the same cost, irrespective of their domicile.
The Big Mac burger was chosen as a benchmark because of its worldwide popularity. As it is consumed by many people all over the planet, it serves as a good indicator of determining the relative cost of living of different currencies in the world.
To simply use this index, the price of a Big Mac in one country, say India, is taken, and its price is compared to the price of the same burger in another country, say the US. But, of course, all such comparison occurs only after converting the price into local currency (usually the USD).
The BMIX indicates whether a currency is overvalued or undervalued. The index has gained popularity worldwide as it is easy to use and understand. Still, it should not be used as the only economic indicator to determine the exchange rate stability of a country.
- The Big Mac Index compares the price of a McDonald's Big Mac burger in various countries to assess whether currencies are under- or overvalued.
- The index calculates the price of a Big Mac in different countries in local currency, converts those prices to a common currency (usually USD), and compares the results.
- The Big Mac Index is based on the economic theory of PPP, which states that in the long term, exchange rates should adjust so that an identical basket of goods costs the same in different countries when priced in a common currency.
- While not a precise scientific measure, the Big Mac Index serves as a useful economic indicator to gauge currency misalignments, inform exchange rate policies, and highlight cost-of-living differences.
History of the Big Mac Index
The BMIX compares the price of Big Mac burgers in different countries to ascertain the relative value of their respective currencies. As a result, the BMIX has been an economic measure and a cultural icon that has evolved over the years.
The idea for the BMIX began in the mid-1980s when the correspondents of The Economist developed an easy and understandable way of explaining PPP. They showed up with the idea of using the Big Mac burger as a benchmark because it was a popular food worldwide.
Writings on BMIX were first published in 1986. Because of its easy-to-understand nature, it caught the public eye. The index is an easy and effective way to compare the relative purchasing power of different currencies.
The index has become more developed and sophisticated by considering important purchasing power factors. For example, it now distinguishes between local taxes, labor costs, variable and fixed costs, etc.
Criticisms of the BMIX have lasted over the years, such as oversimplifying complex global economics and ignoring important economic development factors.
The history of the BMIX is intertwined with economic history and globalization. Economists and investors have used the index to identify exchange rate trends. Also, it helps gain quick information about the under/overvaluation of relative currencies.
Note
The BMIX has undergone several revisions and updates to change world order to improve its accuracy. It has illustrated the relationships between inflation and exchange rates.
How does Burgernomics work?
The calculation for the BMIX is very easy and can be understood even by a 5th grader.

The following steps calculate the Big Mac Index for any two countries.
- Get the price of a Big Mac burger in two countries. For example, we are taking Norway (a foreign country) and the USA (a base country).
- Convert the price of the burgers of both countries to USD($).
- Divide the price in the foreign country (in $) with the price in the base country(in $).
- You'll get an implied exchange rate, i.e., Norwegian Krone(NOK) per USD.
- Get the Actual exchange rate of 1 NOK per USD.
- Calculate the % of under/overvaluation of the implied and actual rates.
Let's gather all the information for NOK (Norwegian Krone) and USD (United States Dollar) here:
NOK is the foreign currency, and USD is the base currency. For example, the price of 1 Big Mac in Norway is $6.26; in the USA, it is $5.15.
Implied Exchange Rate = Price of 1 Big Mac in Norway (in USD$) / Price of 1 Big Mac in USA (in USD$)
1.21 = $6.26 / $5.15
- The Actual Exchange rate of 1 NOK/USD is $0.093.
- The actual exchange rate is 1.21.
- The NOK is overvalued over the USD by 12%(i.e., (1.21-0.093)/0.93*100)).
Note
The BMIX is not a perfect economic measure of PPP because it only compares the price of a single product. It does not account for other factors that can affect the cost of living.
Criticisms of the Big Mac Index
Even though its widespread use and popularity worldwide, the BMIX has many limitations and criticisms developed over the years and has emerged as a key concern area in its accuracy:
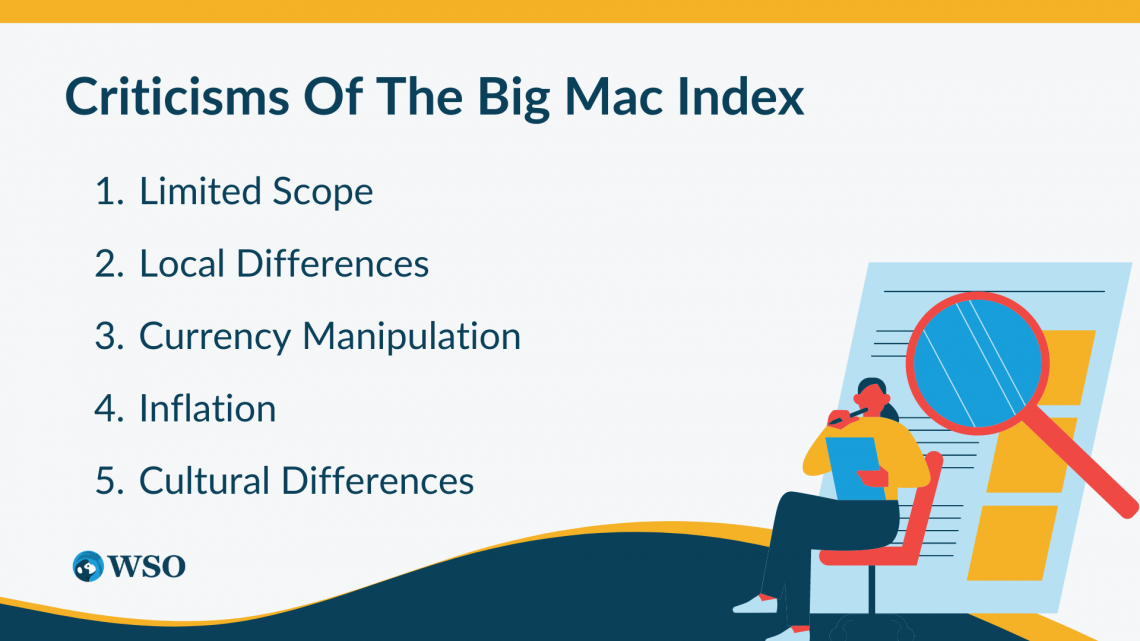
1. Limited Scope
The Big Mac Index has a limited area of exercise as it only measures countries' purchasing power in a relative sense and that too of one product. This may seem inaccurate as it needs to account for many other important factors of production and sales.
2. Local Differences
BMIX has taken the McDonald's Big Mac Burger as a commodity, sold at the same price everywhere in a given country.
Note
There might be cost differences in one part of the country compared to the other, making the price of the same burger distinct across different locations.
3. Currency Manipulation
Some countries may(or may not) manipulate their currency exchange rates to make their currencies seem undervalued and more competitive. These currency undervaluations may make the BMIX index inaccurate and unpredictable in a true sense.
4. Inflation
The BMIX may need to be revised as it needs to account for the inflationary situation of a country. For example, if country A has higher inflation than country B, then the cost of goods of country A will be more than that of B; hence the BMIX index may give a disrupted value.
5. Cultural Differences
The BMIX assumes that the popularity and availability of the Big Mac are the same and consistent worldwide. But this may be different in real life.
Cultural, dietary, and economic differences may affect the demand for the Big Mac in different countries. Unfortunately, this also may lead to inaccuracies.
How the Big Mac Index Reflects Global Economic Trends?
The BMIX effectively tracks global economic trends. The index is based on the theory of PPP, which says that the exchange rates of different countries will adjust in such a manner, making the price of identical goods equal.
If the exchange rates are not equal to PPP, the currency is overvalued/undervalued, which impacts the exchange rate stability.
BMIX reflects global economic trends by revealing differences in living costs between countries. If the value of BMIX is more, then it can mean that cost of living, wages, and currency value is higher than the base country.
Example
If a Big Mac burger is priced at $5 in the US and $3 in India, it means that the Indian Rupee is undervalued in comparison to the USD.
The impact of this undervaluation is a boon to the Indian economy as the cost of production of the Big Mac may be relatively constant across nations. This can make Indian exports cheaper and more competitive in the international markets.
BMIX can also highlight inflation and currency fluctuations. This can be interpreted in two aspects:
- Long-Term: Suppose the value of the BMIX rises in a particular country over a longer period. In that case, it might indicate that the country's inflation is shooting up, and to combat that, higher interest rates are coming into the picture.
- Short-Term: If the value of BMIX changes in a country in a shorter period, it could suggest that political and economic tensions are at play in the country.
Alternative Measures for Purchasing Power Parity (PPP)
The Big Mac Index is a famously used way to determine the PPP of different countries. Still, many other potential tools help economists to evaluate the value of currencies across different nations.
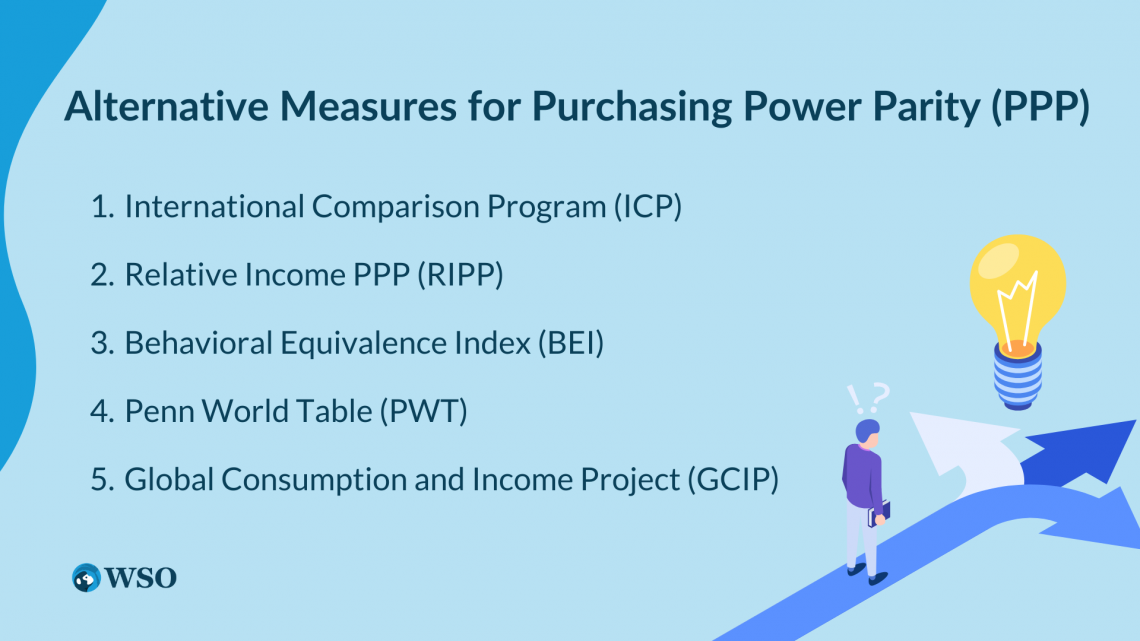
These alternatives may give an insight into global economic trends depending upon the research question.
International Comparison Program (ICP)
The World Bank organizes this. It aims to provide a comprehensive and constant measure of living standards and activities in an economy.
ICP collects relating to housing, transportation, education, healthcare, etc. Then adjusts the differences in quality and quantity to arrive at comparable prices between countries.
ICP is conducted every 5-10 years to achieve the United Nations' Sustainable Development Goals.
Relative Income PPP (RIPP)
This method determines the relative cost of living by considering the difference in income levels. RIPP is based on the assumption that people in different countries have different preferences for consumer goods and services.
These preferences of the different people of different countries are adjusted by assigning weights to the prices of different goods and services depending on the total consumption of people in different countries.
Behavioral Equivalence Index (BEI)
This measure adjusts the differences in the quality of goods and services in different countries. It is based on the assumption that people will pay more for quality goods. Hence prices are adjusted accordingly.
BEI helps provide a more accurate measure of the relative value of goods and services. This measure also helps in assessing the impact of globalization on the preferences of consumers and behavior.
Penn World Table (PWT)
This is a widely used alternative measure for measuring PPP that helps provide data on various macroeconomic variables. Such variables include Gross Domestic Product(GDP), nations' population, capital stock, and prices for a country's broad range of goods and services.
This index uses a complex methodology, adjusting the differences in the cost of living and the quality of goods and services across countries. Nevertheless, economists and policymakers widely use it.
Global Consumption and Income Project (GCIP)
GCIP is also an alternative to measure the PPP, aiming to render an updated and comprehensive measure for living standards across the globe. It also considers income distribution.
GCIP gathers data on income levels and consumption patterns and adjusts the same per the quality and quantity of goods and services, which helps reach comparable prices.
GCIP is used for making policy decisions regarding poverty reduction, social protection, and economic development.

Free Resources
To continue learning and advancing your career, check out these additional helpful WSO resources:


or Want to Sign up with your social account?