Fixed Income Risks
The risks associated with different challenges and uncertainties may/may not impact the fixed-income securities returns.


What Are Fixed Income Risks?
Fixed-income risks are risks associated with different challenges and uncertainties that may/may not impact the fixed-income securities returns.
Before we venture into the world of fixed-income instruments, let us understand why they are a viable investment for most investors. Fixed income instruments assure a predetermined rate of return and keep your initial investment safe.
There are a few advantages to investing in fixed-income instruments. First, to some investors (especially retiree investors and investors who want a stable income), these investments are more attractive than equity.
- The returns from stocks (equity) are associated with the company's performance. Therefore, shares are subject to high volatility. With bonds, your returns are known and guaranteed, and there is less volatility.
- The terms of a fixed-income contract are unambiguous. The issuing entity lays down the interest rate, the investment duration, and the maturity date. Stocks carry no such obligation on the part of the organization.
- If a company files for bankruptcy/liquidation, it pays holders of bonds/debentures before compensating its shareholders. As a creditor, the company would prioritize you over any shareholder.
- Let us keep inflation risk aside for a moment. We will talk about it in the upcoming section. If you invest $50,000 in a bond for five years, you would want that amount back. Bonds ensure that your initial investment is protected.
- Fixed income instruments carry a credit rating. It provides solace to investors who want to know how safe their investment is.
We will use the terms “bonds” and “fixed-income instruments” interchangeably for simplicity. However, fixed income instruments refer to any security that yields a fixed periodic return. These include debentures and preferred stock.
- Fixed income risks refer to the various potential challenges and uncertainties that can affect the returns and value of fixed-income securities, such as bonds.
- Interest rate risk is a primary concern, as changes in interest rates can lead to price volatility in fixed-income investments, impacting their market value and yield.
- Inflation risk pertains to the erosion of the purchasing power of fixed-income returns due to rising prices, which can diminish the real value of interest payments and principal over time.
- Liquidity risk arises when fixed-income securities cannot be easily sold or traded without significantly affecting their price, potentially causing difficulties in accessing invested funds.
Are fixed-income instruments completely risk-free?
Of course not! No investment is risk-free. Yes, that includes the cash you stash under your pillow. Assume that you have $100 stashed under your pillow. That money could have fetched you two weeks' worth of groceries a year ago.
Fast-forward a year, prices have nearly doubled, and you can only purchase a week’s worth of groceries with that money. This erosion of your purchasing power is known as inflation. This risk is called inflation risk.
By now, you know that bonds are not as risky as stocks. However, all fixed-income instruments carry specific risks.
Off the top of your head, what are the significant risks you would associate with fixed-income instruments? Fundamentally, there is always the risk that the person who issued the bond would default on his payment. This is known as default risk.
Default risk exists even in government bonds, usually presumed to be one of the safest asset classes. This is especially true in times of economic recessions or political upheavals.
We can broadly classify fixed-income instruments into three categories:
- Those issued by companies
- Those issued by governments
- Bonds issued in more than one nation (global bonds)
Each of these sub-classes of bonds carries varying degrees of risk. As we already discussed, government bonds are usually the safest among these.
There are two significant risks specific to fixed-income instruments; it would be wise to examine these in detail. They are, namely, interest rate risk and reinvestment risk.
Interest rate risk
Let us take an example to understand interest rate risk. Suppose you are a holder of a bond with an interest rate of 8% and a market value of $100. Eventually, the market interest rates rose to 10%.
Why would you want to hold a bond that pays an interest of 8% when you could purchase a similar bond offering an interest rate of 10%? You would like to sell this bond, but there is hardly any demand for it in the market.
Therefore, you would have to sell it at a price less than its current market value.
We can derive the new price through simple cross-multiplication. The old price of the bond was $100, and the interest rate was 8%. What would be the new price when the interest rate is 10%?

The reduction in the price of the fixed income instrument on account of an increase in interest rates is known as interest rate risk. An investor has two courses of action.
- They can sell the bond at a price less than its market value before the interest rate increases and incur a loss.
- They can hold on to the bond and receive a lower interest than what the market offers, still incurring a loss.
Let us understand a few terms before exploring reinvestment risk and how an investor can counter these fixed-income risks.
Yield Curve
We now know what interest rate risk means. Logically, it follows that the longer the bond’s duration, the higher the risk because the market is more exposed to fluctuations in interest rates in the long term.
Fixed-income securities that mature within a year would not see the market fluctuate wildly. The interest rates would more or less be stable.
What did we learn from this? Bonds with similar credit standing but maturing on different dates would have varying interest rates. A yield curve is a figure that plots the interest rates of similar bonds with differing maturity dates.
Yield curves are of three types. The first type of yield curve is a standard yield curve.
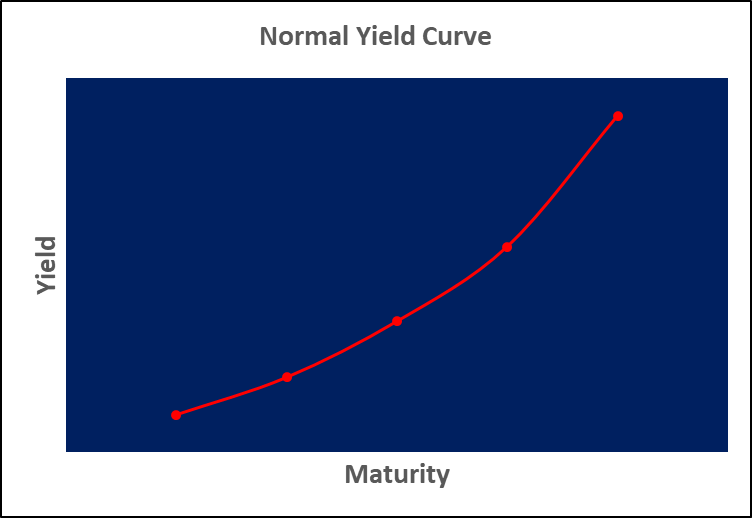
This yield curve indicates that bonds of a shorter maturity will carry a lower interest rate than those maturing in the distant future. We would see this yield curve in economies that show signs of expansion.
The second type of yield curve is the inverted yield curve.
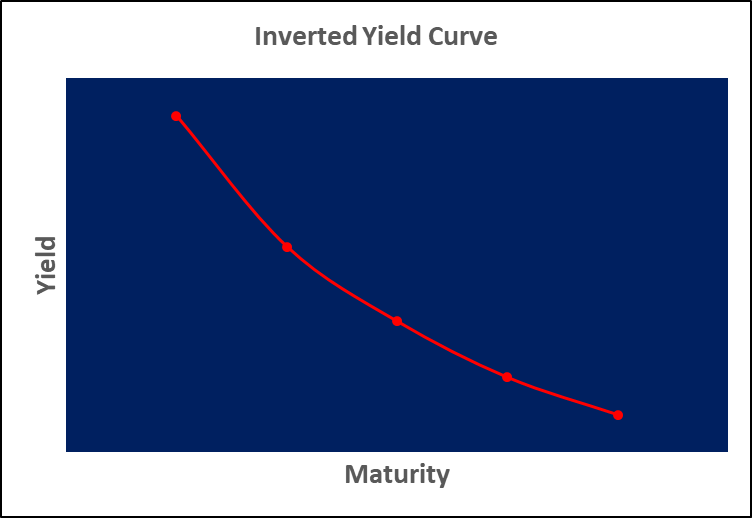
The inverted yield curve indicates that bonds with a shorter maturity period will have higher interest rates. This phenomenon is true in scenarios of economic recession, where interest rates are likely to keep falling as the economy crashes.
The last type of yield curve is the flat yield curve.
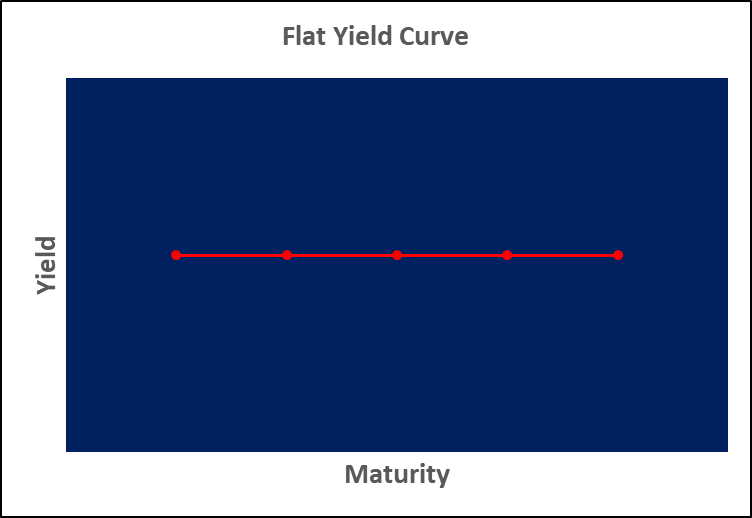
The flat yield curve shows that there is no difference in the interest rates of short-term and long-term bonds. A 5-year and 20-year bond would have similar interest rates, with marginal differences.
We usually see this yield curve when the economy transitions from an inflationary period to a recession or vice versa. The market is uncertain, and investors do not perceive significant differences between short-term and long-term bonds.
Why do we need to study the yield curve? The “yield curve risk” indicates the effect of interest rate changes on an investor’s fixed-income portfolio. Investors could perceive the direction in which the economy is headed and plan accordingly.
Bond Sensitivity
A bond usually has two types of cash flows - the periodic interest payments made to the bondholder and the payback of his initial investment in the bond upon the bond’s maturity.
The intrinsic value of a bond is the present value of all its future cash flows. Bond sensitivity measures the sensitivity of intrinsic value to fluctuations in interest rates.
The higher the sensitivity, the more volatile the bond's price in periods of fluctuating interest rates.
Since the market does not fluctuate much in the short run, bonds of longer duration are more susceptible to interest rate sensitivity. As the bondholder’s expected rate of return changes, the intrinsic value will change too.
Bond sensitivity helps us to calculate the new intrinsic value upon the change in the expected rate of return.
Let us take an example to understand bond sensitivity. Assume that you purchased a ten-year bond with a face value of $500 carrying a coupon rate of 8%.
Note: The coupon rate is distinct from the investor’s expected rate of return. It is the periodic interest obligation of the bond issuer and is always calculated as a percentage of the face value, irrespective of the market price.
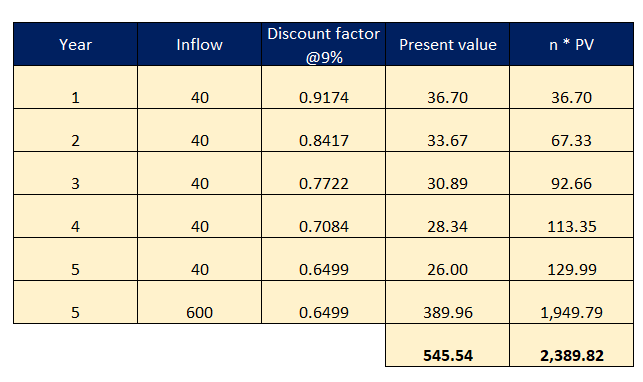
This bond will mature five years from now, and the bond issuer will redeem the bond at a premium of $100, i.e., you will get $600 upon redemption. Currently, you expect the bond to generate a return of 9%.
This rate is the discounting rate we will use to derive the present value (PV) of cash inflows.
Your cash flows are as follows. Every year, you would receive an interest payment of 8% of $500, i.e., $40. In the fifth and final year, you would receive maturity proceeds of $600 in addition to the interest payment.

As you can see, the bond, which is $500 in the market, has an intrinsic value of $546. The bond is underpriced.
The formula for calculating sensitivity is as follows

Where
- n = Number of years till the security matures
- PV = The intrinsic value of the security
- i = The rate of return expected by the bondholder

How do we use this sensitivity figure? Assume that you expect a higher rate of return due to a shift in interest rates. You now want a return of 11%.
| Present value of cash inflows for 9% return | $545.54 |
|---|---|
| Sensitivity | $2,192.50 |
| Increase in the expected rate of return | 2% |
NOTE
“f the expected rate of return increases, the present value of cash flows decreases,
Take the above example with a 10% desired rate of return and see for yourself!
We can apply this factor of 2% to our sensitivity. That would give us a value of $43.85. Since the present value will decrease with an increase in expected returns, we must adjust our intrinsic value.
| Present value of cash inflows for 9% return | $545.54 |
|---|---|
| Less: Sensitivity at a 2% increase in the desired rate of return | $43.85 |
| Present value of cash inflows for 10% return | $501.69 |
Implication: For every 1% change in the expected rate of return, the bond's intrinsic value will change by approximately $22.
Duration of the Bond
Before we discuss what duration means, we need to discuss what duration does not mean. Duration does not refer to the term of the bond. You purchased a bond that matures in 5 years. The date on which the bond matures is the “maturity date.”
However, the duration of the bond is not five years. In the context of fixed-income instruments, “duration” refers to the time frame within which the investor would recover the money he initially invested in the bond.
This duration is known as the “weighted average term to maturity”. The weights are the cash flows, i.e., coupon payments and maturity proceeds. Frederick Macaulay proposed the idea of a weighted average duration.
This concept might get confusing, so we can use an example to understand “duration.” Let us take the same one that we did to understand bond sensitivity.
| Price of the bond | $500 |
|---|---|
| Coupon payment rate | 8% |
| Time till the bond matures | 5 years |
| Maturity proceeds | $600 |
| Your expected rate of return | 9% |
We have derived the bond's intrinsic (present) value. The formula for calculating Macaulay’s duration is as follows -

Where
- n = Number of years till the security matures
- PV = The intrinsic value of the security

Implication: The bond maturing in five years has a duration of 4.381 years. The investor would recover his entire investment in this time frame, provided all the coupon payments and the maturity proceeds are duly paid to him.
Remember the concept of the yield curve? We can say that the higher the duration, the more sensitive the bond is to price fluctuations.
Let us now talk about the modified duration. Again, we can understand the concept and interpretation of modified duration using the above example.
| Macaulay’s duration | 4.38 years |
|---|---|
| Investor’s desired rate of return | 9% |
The formula for calculating modified duration is as follows

Where i = The rate of return expected by the bondholder

Let us interpret this. The modified duration shows the effect of change in interest rates on the bond's price. If interest rates change by 1%, the price of the bond changes by 4.019% in either direction.
After looking at interest rate risk, you’re understandably terrified. However, you should know that long-term bonds compensate you for this risk in the form of a “maturity risk premium.”
As a novice investor, you would understandably be curious about how to protect your bond portfolio. Don’t worry! I won’t leave you hanging.
But before we delve into bond management strategies, let us look at the other significant risk associated with fixed-income instruments - the reinvestment risk.

Reinvestment risk
Congratulations! You just purchased your first bond and received your first interest payment. What do you do now?
You would want to multiply your money. So you decide to invest the receipts from the interest payment in another bond. The interest rate you receive on this bond is known as the “reinvestment rate.”
Things are looking good until you notice a problem with your portfolio. The interest rates have fallen in the past few months. With your old bond, you received interest of 8% per annum.
However, the new bond you purchased carries an interest rate of only 6%, reducing the overall inflow.
On account of the lower interest rate on your new bond, you might decide to sell it. In the previous section, we discussed that if interest rates increase, the price of existing bonds reduces due to low demand.
If you sell the bond and the market interest rates increase afterward, you still incur a loss, albeit notional.
There is a risk known as “prepayment risk” associated with callable bonds. Callable bonds are those that the issuing entity can pay back before the bond matures.
The company has the option to repurchase its bonds after a specified date known as the call date. Since there is an element of uncertainty associated with these bonds, they come at a higher price.
Why are we discussing callable bonds all of a sudden? Reinvestment rate risk is the highest in callable bonds.
For a moment, let us analyze this example from the point of view of a company. Companies want to finance their operations through debt and procure debt at a low cost.
A company has issued bonds on which it must pay an interest of 9%. Shortly after, the interest rates in the market fell to 8%. This is advantageous for the business since it can procure funds at a lower cost.
Since the bonds have an inbuilt call option, the company would repay the old bond and issue new bonds on which they have to pay 8% interest. That’s a clear win!
However, the investor would find this situation undesirable. If market rates have fallen, he would have to invest the proceeds from the buyback into bonds carrying a lower yield than what he was previously receiving.
The magic of zero-coupon bonds!
Enter zero-coupon bonds.
What is the risk associated with a decline in interest rates? The investor would have to purchase bonds of a lower yield.
A zero-coupon bond solves this problem by removing the coupon payment factor altogether! No coupon, no reinvestment risk. When the bond matures, you get its par value and nothing more.
That sounds absurd. No coupon payments? How would you benefit from this investment? What about the time value of money factor?
The standard practice with zero-coupon bonds is to issue them at a discount. If the bond trades at $1000, the company will sell it at $900. Everyone loves a good bargain, right?
You would purchase this bond at $900, and upon its maturity, you would receive a face value of $1000.
Does a zero-coupon bond not offer interest? Think again. Let us say that the bond matures in two years. We can use the compounding formula to calculate the embedded interest rate.

Where
- P = The initial amount invested
- i = The interest rate or compounding factor
- n = Term of the bond
- M = Final proceeds
To calculate interest, let us assume interest to be an unknown variable “i.”
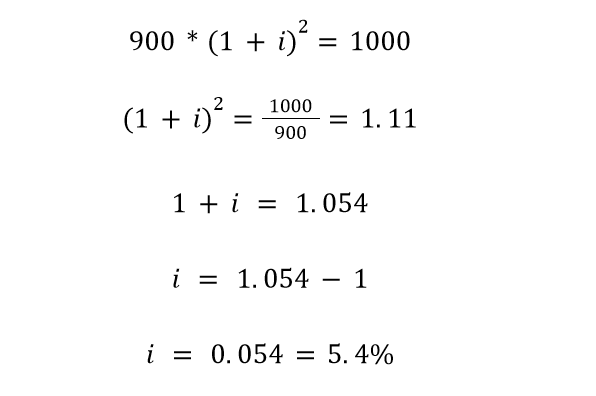
Solve the above equation, and you will see that your investment shows a compounded annual growth rate of 5.4% per annum. You are getting a return!
Interest payments in a zero-coupon bond are only embedded and notional, i.e., you do not receive the proceeds in your bank account. Therefore, there is no reinvestment rate risk.
Bond Laddering
There is another very effective weapon you can use to combat reinvestment risk. Bond laddering is a double-edged sword because it helps counter interest rate risk. You can tailor this strategy to suit your needs.
You want to start saving up to fund your children’s education. Your investment time frame is ten years, and you want to accumulate a future value of $300,000. To counter the effects of reinvestment risk, you can use the laddering strategy.
Under this strategy, you should purchase several bonds of similar credit quality spread across different timeframes. Some bonds would mature in a year, while some would last three, four, six, or even ten years.
This strategy is in line with the fundamental principle of investing - “Don’t put all your eggs in one basket”.
Here are some tips. Check these out before you ladder!
- Ensure that your investment is evenly spread across all bonds and that you do not have a significant stake in any one bond.
- Always go for bonds of high credit quality. Look at trustworthy agencies for the same. The biggest credit rating agencies in the world are Moody’s, S&P Global Ratings, and Fitch Group.
The advantage of bond laddering is that the investor diversifies the risk across all bonds. If one company suffers a credit downgrade, the reduction in bond prices is mitigated by the presence of other bonds of similar or higher quality.

Bond management strategies
The previous two sections dealt with the risks associated with fixed-income instruments. This section will discuss a few strategies you can adopt to counter these risks.
The previous section dealt with bond laddering and zero-coupon bonds. Both of these are effective strategies to combat fixed-income risks. In this section, we will dive deeper into some other strategies that are tailor-made for specific investor sentiments.
From the investor’s perspective, there are four strategies that he can adopt. The first strategy is to buy the bond and hold it until it matures. The investor will reinvest any income from the bond into the portfolio.
Investors who pursue this strategy usually go for non-callable bonds as such bonds reduce the degree of uncertainty. We will look at three strategies in some detail.
- Matching an existing index - Passive investing.
- Actively managing the portfolio - Active investing
- Immunization
Passive Investing or Indexing
It is not feasible for a retail investor to closely track the market and optimize his portfolio to maximize returns by leveraging market trends. He does not have the resources to do so. Instead, he uses a reference known as an “index”.
A market index is a group of investments that are similarly classified. A typical example is a classification based on market capitalization. Some major indexes are the S&P 500, the Dow Jones Industrial Average, and the NASDAQ composite.
Passive investors simply trust the market to work its magic. The indexing strategy would require investors to mimic market performance exactly. Investors select an index and make their investments in the same proportion as that of the index.
While passive investing reduces the hassle of tracking the market, an individual investor can't mimic an index exactly. This activity would require significant time, research, and funds.
Alternatively, the investor could buy an exchange-traded fund (ETF), which is a pool of securities and works like a mutual fund, with the difference being that ETFs can be traded in the stock market like any share.
Active Management
Unlike indexing, active management involves price action trading, making investment decisions on the go, and periodically keeping track of your investment portfolio.
Passive investing does not demand such a strenuous process because the investor relies on an existing benchmark. However, fund managers must generate a higher return than the index to justify active investing.
In investment analysis, this return is called an “Alpha”. Mutual fund managers charge an “expense ratio” that helps them cover all expenses relating to the fund.
Active management requires expertise and resources, and the expense ratio charged for such funds is understandably higher. Mutual fund managers must generate a higher return than the index to justify the higher expense ratio.
The primary criticism of the active management approach is that the market always corrects itself and offers the best possible returns in the long run. As such, active management is unnecessary. This belief mirrors the efficient markets hypothesis.
One of the most common strategies active investors adopt is identifying underpriced securities and benefiting from their potential.
Usually, individual investors do not carry out active management. They employ the services of an asset management firm to execute trades and manage their portfolios.
Immunization
The final strategy from an investor’s perspective is to immunize his portfolio. As we discussed previously, every fixed-income portfolio suffers from interest rate and reinvestment risk. Immunization helps combat these risks.
However, for this strategy to work, you must have more than one bond in your portfolio.
The idea behind the immunization strategy is that two or more bonds maturing on different dates are selected. The weighted average duration of these bonds must equal the investor’s time frame. The weights assigned are the invested amounts.
Another important consideration is that the duration of some of the bonds must be more than your target time frame, and the duration of the others must be less than your target time frame.
Remember the concept of Macaulay’s duration? Let us recap. It is the period it would take for the investor to recover his initial investment, provided all the coupon payments and maturity proceeds are duly made to him.
An example would better help us understand the concept of immunization.
Say you want to save up for your children’s education. You must invest $300,000 for a term of 10 years if you are to meet their educational expenses. After extensive research, you shortlisted two bonds for your portfolio.
Bond M has a nominal value of $200 and trades in the market for $250. It has a Macaulay's duration of 12 years.
Bond W has a nominal value of $300 and trades in the market for $200. It has a Macaulay’s duration of 6 years.
Notice that the duration of bond M is more than your target time frame of 10 years, and the duration of bond W is less than your target time frame of 10 years.
Now we execute the immunization strategy. The investment you wish to make is $300,000. As I mentioned, the weights assigned are the amounts you will invest in each bond.
You need to allocate your investment in such a way that the sum of the weights is $300,000, and Macaulay’s duration of your portfolio as a whole is ten years, which is your target time frame.
Great! We can now calculate the duration of our portfolio using the given formula.

Where
- Dp = The duration of the portfolio (10 years)
- DM = The duration of bond M (12 years)
- DW = The duration of bond W (6 years)
- PM = The proportion of money invested in bond M
- PW = The proportion of money invested in bond W
Logically, it follows that PM + PW = 100%, which is the total amount invested. Let us use a bit of elementary math.
Subtract PW from both sides. Now, PM = 100% - PW. I did this because we shouldn’t be working with two unknown variables in our calculation.
Substituting the values in the above formula, we do the following calculation.

We only have to solve for one unknown, which is PW. Solving the above equation, PW is ⅓, i.e., one-third of our total investment is in bond W. We must invest $100,000 in bond W. Therefore, we will invest the remaining $200,000 in bond M.
We know that the market price for bond M is $250, and that of bond W is $200. With our investment, we could purchase 800 bonds from Company M and 500 from Company W.
Free Resources
To continue learning and advancing your career, check out these additional helpful WSO resources:


or Want to Sign up with your social account?