Money vs. Time-Weighted Return
Money-Weighted Return (MWR) and Time-Weighted Return (TWR) are performance measures used to evaluate investor performance


What are Money and Time-Weighted Return?
Money-Weighted Return (MWR) and Time-Weighted Return (TWR) are performance measures used to evaluate investor performance. Both depend on the holding period yield (HPY), which is the percent change of the investment position's market value.
For example, if an investment’s initial value (possibly at the start of the period) is $10,000 and is then $15,000 at the end of the period, it has an HPY of 50%, calculated as follows:

Here’s another example: If an investment’s initial value is $20,000 and its end value is $12,000, then it has an HPY of -40%, calculated as follows:

For any security or portfolio, there are two basic reasons for the ending and beginning values differing: Either cash payments were received (such as dividends), or the price changed (such as capital gains).
A dividend is a sum of money paid periodically (usually quarterly) by a company to its shareholders. Capital gains are the profits from selling an investment.
As seen from these examples, HPY can have either a positive or negative value. There are multiple reasons why this can occur, such as inflation and stock devaluation, among others.
- Money-Weighted Return (MWR) considers the timing and amount of cash flows along with investment performance. It's the discount rate that equates the present value of cash flows to the initial investment.
- MWR is calculated similarly to the Internal Rate of Return (IRR) and requires specific software or financial calculators.
- Time-Weighted Return (TWR) evaluates a manager's performance regardless of cash flow timing or size. It provides a more accurate assessment of the portfolio manager's skills.
- TWR is calculated based on HPY for each period, and it's not influenced by cash flows.
What is Money-Weighted Return (MWR)?
Money-weighted return (MWR) measures an account's performance, including the timing and amount of cash flows, as well as the performance of the underlying investments.
It is the discount rate that sets the present value of future cash flows at the same level as the initial investment.
Thus, the MWR can be calculated in the same way as the internal rate of return (IRR). In financial analysis, potential investments are evaluated using the internal rate of return (IRR). The formula for MWR is as follows:

- i = the particular period (0, 1, 2, 3, …, n), with i = 0 indicating the initial investment
- n = the total number of periods
- CF = cash flows
However, notice that this formula is not solved for MWR. That’s because this variable cannot be calculated analytically. It must be calculated with specific software (such as Excel or other applications) or a financial calculator.
Since calculating MWR in a financial calculator requires the same process as calculating IRR, let’s see an example of calculating IRR from a given set of cash flows:
Let’s say we bought a share of stock for $100 that pays an annual dividend of $5. We then sell it for $200 after 5 years. If we wanted to calculate the IRR, this is how it’d be substituted in the formula:

Using a finance calculator, you can calculate IRR by entering the following data in the CF function and then calculating the IRR:
- CF0 = -100
- CF1 = 5, F1 = 1
- CF2 = 5, F2 = 1
- CF3 = 5, F3 = 1
- CF4 = 5, F4 = 1
- CF5 = 205, F5 = 1
This gives us an IRR of 18.77%.
How to Calculate Money-Weighted Return?
Now that we have seen how to determine HPY and IRR let’s see how this would be implemented in calculating Money-Weighted Return.
For example, let’s calculate the MWR of two portfolios, each with the same funds and capital gains over a two-year period per the following table. The only difference is the timing of these invested funds.
| HPY | Cash Flows | |||
|---|---|---|---|---|
| Portfolios | Period 1 | Period 2 | Period 1 | Period 2 |
| A | 20% | 10% | $600,000 | $0 |
|
B |
20% | 10% | $300,000 | $300,000 |
Let’s first determine the cash flows for the formula since there are different HPY’s throughout the investment’s total evaluation period. Then we can find the IRR using a financial calculator. In this case, that IRR value is the MWR value.
For portfolio A:
- CF0 = -$600,000
- CF1 = $0, F1 = 1
- CF2 = $600,000(1+ 0.2) (1+ 0.1) = $792,000 , F2 = 1
- IRR = 14.89%
Therefore, portfolio A’s MWR = 14.56%
For portfolio B:
- CF0 = -$300,000
- CF1 = -$300,000, F1 = 1
- CF2 = $300,000(1+0.2) (1+0.1) +$300,000 (1+0.1) = $726,000 , F2 = 1
- IRR = 13.40%
Therefore, portfolio B’s MWR = 13.40%
Even though both managers invested the same amount of funds with the same yield per period, the manager for portfolio A obtained an MWR that was higher than portfolio B’s manager. This is because the cash flows entered at different points of the period.
In this case, the MWR gives a misleading impression of portfolio B’s manager. Here, the investor greatly affected the results by making their investment in parts, whereas portfolio A’s investor did so within the same period. This was not a reflection of the manager’s abilities.
Here is an example where we have only the cash flows of two portfolios managed by different investment managers. The following table shows managers buying identical stocks at identical prices but in varying amounts due to how much is invested by the investor before selling them.
| Period 1 | Period 2 | Period 3 | |||||||
| Portfolio | Stock Price | Dividend | Shares Bought | Stock Price | Dividend | Shares Bought | Stock Price | Dividend | Shares Bought |
| A | $50 | $2 | 100 | $60 | $3 | 50 | $65 | $3.5 | 0 |
| B | $50 | $2 | 75 | $60 | $3 | 60 | $65 | $3.5 | 10 |
Let’s determine the cash flows for the formula since the investor is investing funds for which to buy more stocks and is also receiving dividends from them. These are the cash flows, assuming that the stocks were sold at $70 per share at the end of the final period.
For portfolio A:
Total funds invested in the stock: $50 (100) + $60 (50) + $6 (50) = $8,000
- CF0 = - $50 (100) = -$5,000
- CF1 = $2 (100) - $60 (50) = -$2,800, F1 = 1
- CF2 = $3 (150)- $65 (0) = $450, F2 = 1
- CF3 = $3.5 (150) + $70 (150) = $11,025 , F3 = 1
- IRR = 15.90%
Therefore, portfolio A’s MWR = 15.90%
For portfolio B:
Total funds invested in the stock: $50 (100) + $60 (50) + $6 (50) = $8,000
- CF0 = - $50 (75) = -$3,750
- CF1 = $2 (75) - $60(60) = -$3,450 , F1 = 1
- CF2 = $3 (135) - $65(10) = -$245 , F2 = 1
- CF3 = $3.5 (145) + $70 (145) = $10,657.50, F3 = 1
- IRR = 15.48%
Therefore, portfolio B’s MWR = 15.48%
Again, notice that portfolio A’s manager has a higher MWR than portfolio B’s manager even though both had the same total money to invest. Although they chose the same stock and invested the same funds, the MWRs were different because of the timing of the cash flow.
Thus, the primary value of MWR as an assessment method is to give an accurate assessment of the investor’s return and not the portfolio manager’s talent. Therefore, to get an accurate assessment of the portfolio manager’s performance, the time-weighted return is used.
What is Time-Weighted Return (TWR)?
Time-weighted return (TWR) is used to evaluate a manager's performance regardless of the size or timing of the investment funds. Investors consider this to be a true indicator of portfolio performance.
Whereas the MWR is a useful indicator for determining if investment goals will be met, the TWR is an indicator of portfolio performance. Their main difference is the effects of cash flow; MWR takes cash flows into consideration, while TWR doesn’t. The formula is as follows:

- i = the particular period (1, 2, 3, …, n)
- n = the total number of periods
If we use the first example of portfolio A and portfolio B from the previous section, we can mathematically determine that both managers’ performances were the same even though the portfolios’ performances were different.
For portfolio A:

For portfolio B:

Notice that the TWR for both portfolios was 14.89%. This is because both managers achieved an HPY of 20% and 10% per period, respectively. This means that they managed the portfolios with the same skills.
The difference in final monetary value was due to the different cash flows. We can see that this is also the case with the second example.
How to Calculate Time-Weighted Return?
Let’s determine the HPY for each period and then calculate each portfolio’s Time-Weighted Return.
For portfolio A:

For portfolio B:
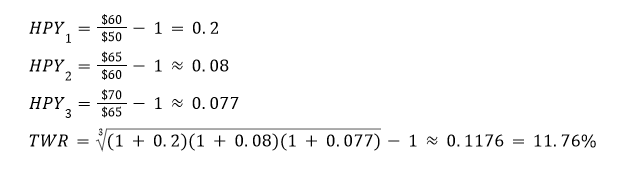
Again, notice that the TWR for both portfolios was 11.76%. This is because both managers achieved the same HPY per period respectively. This means that they managed the portfolios with the same skills. The difference in final monetary value was due to the different cash flows.
This result confirms what can be deduced from observing how both portfolios were managed. Both managers bought the same stock within the same periods with the same total funds invested. The only difference is how much was invested by the investor per period.
Reporting MWR and TWR
The 2020 edition of GIPS gives GIPS-compliant firms the option of presenting either TWR or MWR. Global Investment Performance Standards (GIPS) are ethical principles set by the CFA Institute for investment companies.
This is a relief for the alternative community. 2010 GIPS standards required private equity funds to present a series of since-inception MWRs. However, all other investment structures and strategies had also to include annual TWRs. Now, they can choose which to report.
As a result, firms have had greater flexibility in providing performance presentations that more closely reflect performance data. This data is what the target market is used to track, including the ability to present MWRs or TWRs, and single since-inception return statistics.
Since TWR is a better indicator of a portfolio manager’s performance, reporting these statistics in lieu of MWR can further promote a firm’s abilities to invest a client's funds better.
Having this option means that the firm can also present MWR if it controls the timing of external cash flows into the composite or pooled fund. However, these funds must either be closed-end, fixed-life, fixed commitment and/or have a significant part of the investment be illiquid.
Note
A composite is an aggregation of one or more portfolios managed according to a similar investment mandate, objective, or strategy. Pooled funds must be included in composites if they meet the definition.
Alternatively, if a company has historically been showing TWR, it can switch from TWR to MWR with a disclosure of the change. This disclosure requires a minimum of 1 year.
Money vs. Time-Weighted Return FAQs

The main difference is that MWR takes cash flows and their timing into account for its calculation; TWR doesn’t.
Both returns depend on the holding period yield (HPY).
MWR can be calculated similarly to IRR but cannot be done analytically. MWR can only be calculated with Excel, a financial calculator, or some other computer-based or web-based application.

i = the particular period (0, 1, 2, 3, …, n), with i = 0 indicating the initial investment
n = the total number of periods
CF = cash flows
TWR can be calculated with the following formula:

i = the particular period (1, 2, 3, …, n)
n = the total number of periods
HPY = holding period yield
From 2020, firms can choose whether to report only MWR, only TWR, or both or can alternate between them after documentation for 1 year.


Researched and authored by Gilberto Morales | LinkedIn
Free Resources
To continue learning and advancing your career, check out these additional helpful WSO resources:


or Want to Sign up with your social account?