Debt/EBITDA Ratio
A financial metric that assesses a firm's ability to pay its debts utilizing the EBITDA.
 Yang")

What Is The Net Debt To EBITDA Ratio?
The Net Debt to EBITDA ratio is a financial metric that assesses a firm's ability to pay its debts utilizing the earnings before interest, taxes, depreciation, and amortization (EBITDA).
The net debt to EBITDA ratio significantly indicates a company's debt level. The ratio can be found by subtracting cash or cash equivalents from corporations' interest-bearing liabilities to get net debt and dividing it by its EBITDA.
The computation reveals the number of years necessary for a corporation to settle its debt, assuming net debt and EBITDA remain constant. If a company was required to pay off all debts immediately, net debt would come into play as a gauge of its liquidity.
In this way, it indicates whether there is enough cash to cover all outstanding debts. This can also measure whether there is enough liquidity to fulfill obligations.
To calculate net debt, the initial step is to total all debt and cash equivalents. From these figures, we subtract the sum of cash or liquid assets from the total debt. Total debt for a hypothetical enterprise can be evaluated by combining its existing liabilities and assets.
EBITDA is an acronym that stands for:
- E: Earnings
- B: Before
- I: Interest
- T: Taxes
- D: Depreciation
- A: Amortization
This metric assesses a company's operational efficiency. EBITDA eliminates non-cash expenses like depreciation, amortization, taxes, and debt costs. This calculation aims to showcase the amount of cash profit the company generates from its operations.
Calculating EBITDA can be done through two different formulas. The first equation involves summing up Net Income, Interest Expense, Taxes, and Depreciation & Amortization. Meanwhile, the second equation incorporates Operating Income alongside Depreciation & Amortization for an alternate EBITDA calculation.

A company's leverage can be analyzed using the net debt to EBITDA ratio. However, the debt-to-EBITDA ratio also suffices. These two ratios both compare a company's total debt to its EBITDA.
The difference lies in whether the metric includes cash and cash equivalents. Net debt includes cash and cash equivalents in its calculation, while the debt-to-EBITDA ratio does not.
Net debt represents how much a company owes after factoring in any available cash or cash equivalents that could potentially be utilized to pay off the debt.
- The Net Debt to EBITDA ratio is a financial metric that measures a company's ability to pay off its debt using its earnings before interest, taxes, depreciation, and amortization (EBITDA).
- It is calculated by dividing the company's net debt (total debt minus cash and cash equivalents) by its EBITDA. A lower ratio indicates less financial risk, while a higher ratio may signal potential challenges for investors and creditors.
- This ratio is widely used by analysts and investors to assess a company's financial health, compare it to industry peers, and evaluate its capacity for future growth and investment.
- Understanding the Net Debt to EBITDA ratio helps stakeholders gauge the sustainability of a company's capital structure and its resilience in various economic conditions.
Understanding Net Debt to EBITDA
Net Debt to EBITDA is a financial ratio measuring a company's leverage and ability to repay debt. It is calculated by dividing a company's EBITDA by its interest-bearing liabilities subtracted from cash or cash equivalents.
This ratio is crucial for assessing a company's financial leverage and capacity to repay debt. A ratio <3 is generally considered acceptable, indicating a lower risk of financial distress. Ratios >3 or 4 are often seen as warning signs, suggesting a higher likelihood of future financial difficulties.
Financial performance for companies is evaluated using EBITDA. While conventional earnings or net income is used in most cases, EBITDA serves as a substitute in some situations because it grants a more unfiltered view of the revenue.
Net debt can be determined by finding total debt and subtracting cash or cash equivalents. It represents the actual debts incurred by a company, excluding the funds that could be utilized to discharge those debts, such as cash.
Note
Because financing and accounting decisions are negated, EBITDA is an effective metric for profitability comparisons between industries and companies.
Credit rating agencies frequently use the net debt to EBITDA ratio to assess a company's potential for defaulting on its debt. Higher ratios may warn these agencies that it is more likely to default on their debt since the debt burden is greater.
Analysts often prefer to observe a low ratio within companies, which denotes that the company is not excessively indebted and likely able to meet its financial obligations.
Conversely, a high ratio signals that the company is currently grappling with a substantial amount of debt. This leads to a lower credit rating and investors demanding higher bond yields to offset the increased default risk.
How to use Net debt to EBITDA?
Using the Net debt to EBITDA ratio can provide valuable insights into a company's financial health and reliability. Here's how it can be effectively used:

1. Credit Rating Assessment
Credit rating agencies rely on this ratio as a means to ascertain a company's reliability.
2. Financial Analysis
Analysts tend to favor a lower ratio, representing lower debt obligations when examining a company's finances.
3. Risk Evaluation
A ratio above 4 or 5 typically raises concerns, as it suggests the company may struggle to meet its debt responsibilities and may struggle to secure more funding for growth.
4. Solvency Assessment
Conversely, a low ratio gives reason to believe the company can manage its financial obligations and remain solvent. Solvency is defined as the ability of a company to pay off its debt.
Companies can experience both advantages and drawbacks from debt. When appropriately implemented, a company can acquire the essential funding to advance and flourish without sacrificing equity to investors.
5. Industry Comparison
A company's ability to generate cash can be hindered by excessive debt, harming common stockholders that aren't prioritized when companies go bankrupt. The ideal Net debt to EBITDA ratio differs depending on the industry.
Note
Come May 2023, different industries will exhibit varying average Net debt to EBITDA ratios. For instance, Advertising Agencies would have 2.98, Aerospace & Defense would have 1.49, Agricultural Inputs would have 1.53, and Airlines would have 4.36.
Generally, a ratio that is below 3 is considered good as it suggests that the company has a satisfactory level of debt. On the other hand, a high ratio could signify that the company is having difficulties in discharging its debts.
Financial difficulties in the future may loom if a company has a higher level of debt compared to other companies in the same industry. A higher-than-average Net debt to EBITDA ratio may indicate this and cause concern as the company struggles to pay off its debts.
Companies with lower debt levels than their industry counterparts may have a competitive advantage due to reduced expenses from interest and short-term debt. As a result, investors may favor companies with lower ratios.
Limitations of Net Debt to EBITDA
While the Net debt to EBITDA ratio is a useful financial metric, it has certain limitations that should be considered:
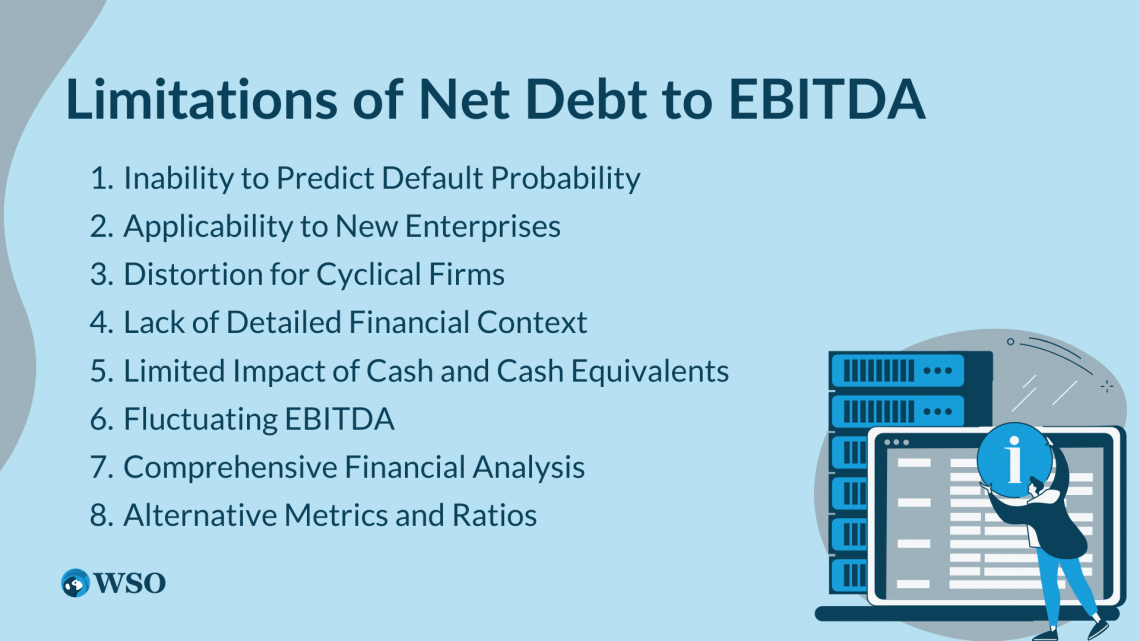
1. Inability to Predict Default Probability
It is incapable of pre-empting a company’s probability of defaults.
2. Applicability to New Enterprises
Fresh enterprises can register negative values for this ratio due to low income and high debt.
3. Distortion for Cyclical Firms
Occasionally, cyclical firms see unusual EBITDA figures that give rise to a distorted ratio.
4. Lack of Detailed Financial Context
It is imperative to highlight that this metric fails to incorporate the finer details of a business’s financial circumstances, such as the tenure of its debt or the type of its cash inflows.
5. Limited Impact of Cash and Cash Equivalents
The Net debt to EBITDA ratio may not accurately depict a company's debt repayment abilities when significant amounts of cash or cash equivalents are available - yet another limitation of the ratio.
The company's overall debt is higher than its net debt in such cases. As a result, the Net debt to EBITDA ratio is lower. Yet, this does not automatically imply that the company is better positioned to settle its debts.
6. Fluctuating EBITDA
The Net debt to EBITDA ratio may not accurately reflect a business's debt repayment capability when its EBITDA shows frequent fluctuations.
Note
Suppose a company's earnings vary significantly from one year to the next. In that case, the EBITDA becomes an unreliable guide for assessing its capacity to produce cash flow and repay its debts.
7. Comprehensive Financial Analysis
The Net debt to EBITDA ratio fails to evaluate the company's economic condition accurately. Assessing a company's financial health involves numerous financial metrics, with the Net debt to EBITDA ratio being just one.
8. Alternative Metrics and Ratios
Although this ratio is significant in determining a company's debt payment potential, considering other financial metrics and ratios concurrently is crucial in comprehending a company's finances more thoroughly.
In fundamental analysis, other metrics regarding income other than EBITDA may provide a unique perspective about the company. Similarly, debt metrics other than net debt can provide a fuller picture of the company’s capital structure.
Example of Net debt to EBITDA
With its diversified coffee offerings that cater to coffee lovers' various tastes, preferences, and budgets, Coffee Holding Co., Inc. (JVA) takes pride in being a top-notch wholesale coffee roaster and dealer in the US.

Despite not being debt-free, the company maintains a net debt-to-EBITDA ratio of 4.2. This indicates that the company has $4.2 of net debt for every dollar of EBITDA, calculated by subtracting cash and cash equivalents from total debt.
Net debt to EBITDA ratio above 4 or 5 raises concerns among analysts, investors, rating agencies, and creditors. High ratios like this indicate a significant debt burden, which may pose challenges for the company in meeting its debt obligations and securing additional funding for growth.
Credit rating agencies evaluate a company's creditworthiness through various financial ratios. Coverage, liquidity, profitability, and leverage ratios are important ratios credit rating agencies evaluate.
Note
Industry-specific factors can influence this ratio greatly, given that capital requirements differ markedly across industries. As such, the most accurate benchmark for comparison is companies operating within the same industry.
A company's ability to generate profit in relation to revenue, balance sheet assets, and shareholders' equity is measured by profitability ratios. Leverage ratios compare debt to other accounts on a balance sheet, income statement, or cash flow statement.
Coverage ratios measure the coverage income, cash, or assets provided to debt or interest expenses. Liquid ratios measure a company's ability to pay short-term debts as they become due.
Debt levels can be analyzed using leverage ratios compared to other financial statement accounts. These ratios are useful in determining a company's capacity to repay debts and are commonly found on a balance sheet, income statement, or cash flow statement.
Popular Leverage Ratios
A handful of the more popular leverage ratios credit analysts use include:
1. Debt-to-assets Ratio
Total assets and debts are compared in the debt-to-assets ratio to determine a company's credit risk. This ratio is calculated by dividing the total debt by the total assets, implying a higher ratio indicates more leverage.
2. Debt-to-equity Ratio
The debt-to-equity ratio is calculated by dividing total debt by total shareholders’ equity. A higher ratio indicates a higher credit risk.
3. Debt-to-capital Ratio
This ratio indicates how much debt a company has in relation to its overall capital. Shareholders' equity is included in the calculation of capital.

To arrive at the debt-to-capital ratio, divide the total debt by the total capital figure. The debt-to-capital ratio can be a measure of credit risk based on the amount of leverage a company has. The higher the ratio, the more leverage in relation to capital.
4. Debt-to-EBITDA Ratio
EBITDA ratio - the fundamental metric of firms' leverage – measures total debt against the sum of depreciation, amortization, taxes, and interest. A hefty ratio espouses a greater propensity to debt and consequently poses increased credit risk.
These leverage ratios help evaluate a company's credit risk based on its level of indebtedness. Higher ratios indicate more leverage and potentially increased credit risk. However, it is essential to consider these ratios alongside other financial metrics and factors to obtain a comprehensive understanding of a company's financial health.

Free Resources
To continue learning and advancing your career, check out these additional helpful WSO resources:


or Want to Sign up with your social account?