One-Period Dividend Discount Model
A Model that assists investors in calculating a stock's intrinsic value based on anticipated future payments.


What Is the One-Period Dividend Discount Model (DDM)?
The One-Period Dividend Discount Model (DDM) is a popular valuation technique in finance that assists investors in calculating a stock's intrinsic value based on anticipated future payments. This model is particularly useful for valuing stocks that pay regular dividends to their shareholders.

By discounting these dividends back to their present value, the DDM provides investors with an estimate of what a stock is truly worth.
The basic principle behind the One-Period DDM is that the value of a stock is equal to the present value of all the dividends it is expected to pay in the future, discounted at an appropriate rate of return.
The model only considers the dividends for one period and assumes that payments are made at the end of each quarter. The formula for the One-Period DDM is relatively straightforward:
V₀ = D₁ / (1 + r)
Where:
- V₀ represents the stock's intrinsic value at time zero (the present value).
- D₁ represents the expected dividend to be paid at the end of the first period.
- r represents the required rate of return, also known as the discount rate.
This methodology calculates the stock's intrinsic value using the dividend for the first period.
The discount rate, also known as the necessary rate of return, represents the minimum return an investor expects to receive for assuming the investment's risk. It is typically derived from the company's cost of capital or the investor's required rate of return for similar investments.
The One-Period DDM is often considered a simplified version of the Dividend Discount Model, which extends the concept to multiple periods.
While the One-Period DDM may not capture all the complexities of stock valuation, it can still provide a useful estimate of a stock's intrinsic value in situations where dividends are a significant component of total return.
Additionally, it assumes that the investor will hold the stock for only one period, which may not reflect the actual investment horizon of investors.
Despite these limitations, the One-Period DDM remains a valuable tool for investors looking for a quick estimate of a stock's intrinsic value based on its expected dividend payments.
It offers a clear framework for comprehending how dividends and stock value relate, empowering investors to make better-educated investing decisions. The One-Period DDM is a straightforward yet effective approach to estimating the intrinsic value of a stock based on its expected dividends.
- The One-Period Dividend Discount Model (DDM) is a valuation method used to estimate the intrinsic value of a stock based on its expected dividend payment for one period.
- Investors use the One-Period DDM to compare the calculated intrinsic value with the current market price to determine whether a stock is undervalued, overvalued, or fairly priced.
- Limitations of the One-Period DDM include its reliance on accurate dividend forecasts, the assumption of constant dividends, and the exclusion of other factors influencing stock prices, such as growth prospects and market sentiment.
- The formula for the One-Period DDM is V0 = D1 / (1 + r), where V0 is the current stock price, D1 is the expected dividend payment, and r is the required rate of return or discount rate.
Example Of The One-Period Dividend Discount Model
Let's set up an example to better understand the use of the one-period DDM and the formula.
For instance, if an investor is wondering about the fair price of a stock. The stock will pay a $5 dividend during the period, the rate of return of 10 percent is known to us and the expected value at the conclusion of the period is estimated to be $100.
The total cash flow the investor will receive at the conclusion of the period will be D1 plus P1 since, according to the calculation, dividends are D1, and the predicted stock value is P1. Now, that sum is discounted at the rate of return to calculate the present value of the cash flows.
Present Market Price = ($100 + $5) / (1 + 0.10) = $95.45
Therefore, the stock's fair market value is 95.45.
If the investor's assumptions are accurate, the stock will equal $95.45. The investor is aware that the stock is probably not worth buying if it is currently selling at that price because there aren't any sizable profits to gain.
The stock is undervalued if the share price is trading below $95.45. The investor would then consider purchasing the share(depending on their confidence in their calculations).
On the contrary, if the stock is trading above the projected market price, the investor would be informed that the investment is expensive and should be avoided. The stock is intrinsically worth less than estimated; therefore, it is safer to explore alternative investments.
One Period Dividend Discount Model’s Component: Estimating Dividends
One of the key components of using the one-period dividend discount model is the estimation of future dividends. While it is impossible to predict dividends with absolute certainty, various approaches and considerations can help investors forecast these cash flows.
- Historical Dividend Analysis: A useful starting point is to analyze the historical dividend patterns of the company. This involves examining the company's past dividend payments, growth rates, and consistency. Examining the historical dividend trends provides insights into the company's dividend policy and potential for future growth.
- Fundamental Analysis: Fundamental analysis involves evaluating a company's financial health and ability to generate sustainable earnings and cash flows. The company's potential to pay dividends in the future may be inferred from variables including revenue growth, profitability, cash flow generation, and capital expenditure plans.
- Additionally, assessing the company's dividend payout ratio (the proportion of earnings distributed as dividends) can indicate the sustainability of its dividend payments.
- Industry and Economic Outlook: The performance of a company's industry and the broader economic conditions can significantly impact its ability to pay dividends. Because of this, it is crucial to consider the industry's growth potential, marketplace dynamics, and governmental or economic issues impacting the business.
- A robust industry and a favorable economic environment can support dividend growth, while adverse conditions may limit dividend payments.
- Management Guidance: Company management often guides future dividend policies and expectations. Reviewing management statements, earnings conference calls, and annual reports can provide valuable insights into their intentions and dividend projections.
- Peer and Market Comparisons: Comparing a company's dividend policies and performance with its industry peers can help investors assess its relative standing. Examining dividend yields, dividend growth rates, and payout ratios of similar companies in the market can provide a benchmark for estimating dividends.
- This comparative analysis can highlight whether a company's dividend performance is above or below average and help identify potential outliers.
- Analyst Reports and Consensus Estimates: Analysts who cover the company provide earnings and dividend forecasts. These reports can serve as a valuable reference point for estimating future dividends. Consensus estimates, which aggregate forecasts from multiple analysts, can provide a more balanced and comprehensive view of dividend expectations.
- Sensitivity Analysis: Since dividend estimates involve some level of uncertainty, conducting sensitivity analysis can help evaluate the impact of different dividend growth scenarios on valuation outcomes. By varying dividend growth rates within a reasonable range, investors can assess the model's sensitivity to changes in these inputs and better understand the potential range of intrinsic values.
- It is important to note that estimating dividends is an inherently challenging task, and no method can guarantee perfect accuracy. Therefore, investors should approach dividend estimation cautiously and supplement their analysis with other valuation techniques and market information.
Determining the Discount Rate
The discount rate is crucial in valuing stocks in the one-period dividend discount model (DDM).

It reflects the required rate of return or the opportunity cost of investing in a particular stock. Determining an appropriate discount rate is essential to ensure an accurate valuation using the one-period DDM.
1. Risk-Free Rate
The risk-free rate serves as the foundation for the discount rate calculation. It represents the return an investor can earn on a risk-free investment such as government bonds.
Treasury bills or bonds are often used as a proxy for the risk-free rate. The choice of the risk-free rate depends on the country and the currency in which the stock is valued.
2. Equity Risk Premium
Compared to risk-free investments, the equity risk premium is the extra return investors need to offset the increased risk of stock investing.
It displays what the market believes the stock will do in relation to the risk-free rate.
Note
Market volatility, investor mood, and economic conditions are a few examples of the variables that affect the equity risk premium.
3. Beta
Beta measures the systematic risk of a stock relative to the overall market. It indicates the sensitivity of a stock's returns to fluctuations in the market. A stock with a beta of 1 is expected to align with the market, while a beta greater than 1 suggests higher volatility.
Beta can be estimated using historical data or obtained from financial databases. Incorporating beta into the discount rate calculation accounts for the stock's risk level.
4. Company-Specific Risk Factors
In addition to the systematic risk captured by beta, company-specific risk factors should also be considered. These factors may include industry-specific risks, the company's financial health, management quality, competitive position, and other relevant factors.
Assessing company-specific risks allows for a more accurate determination of the discount rate. It is important to remember that subjectivity and judgment are involved in determining the discount rate.
Note
Different investors may have different risk tolerances and expectations, which can lead to variations in discount rate choices.
Furthermore, the discount rate should be periodically reassessed and adjusted as market conditions and company-specific factors change.
One-Period Discounted Dividend Model Limitations
One-period DDM shares several limitations as a standard DDM. However, predicting the dividend payments for one term can be a simpler assumption than predicting many years out, as you would for any standard DDM.
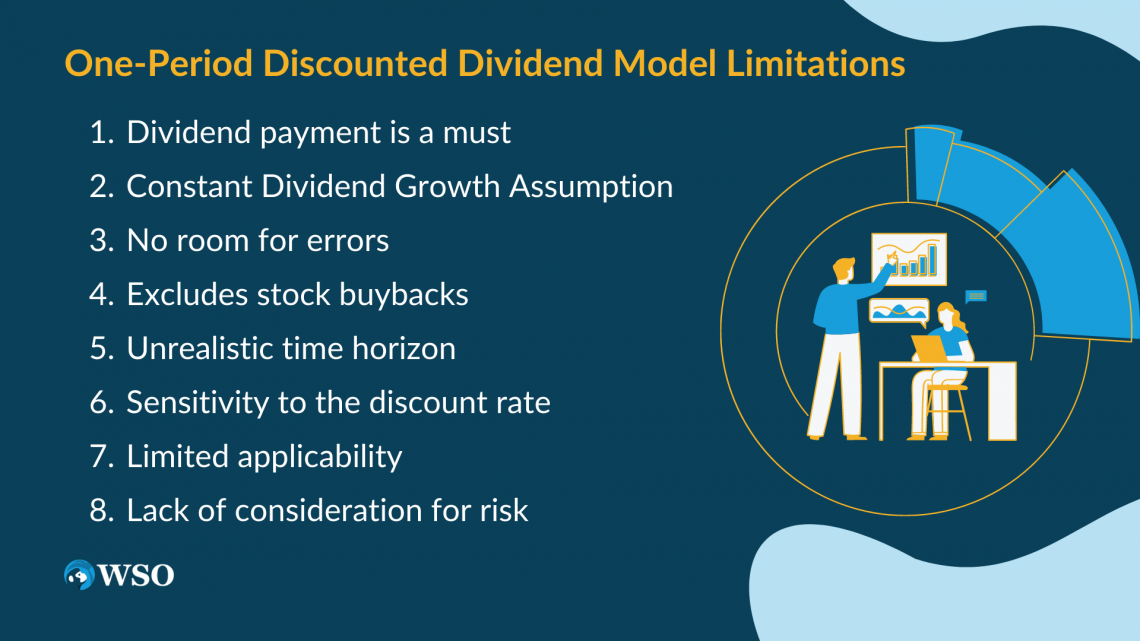
1. Dividend payment is a must
The main limitation of any DDM is that the company must pay out dividends for the model to be effective, regardless of any capital gains from the stock. The model is based on the theory that the only value of the stock is the return on investment (ROI) that it provides through dividends.
Note
The valuation tool also only works if the company is increasing its dividend at a constant rate.
For the sake of the one-period model isn't as much of a drawback because the dividends aren't likely to change too much over a year; however, if they were to, it would affect the calculation.
This limits the use to mature, dividend aristocrat companies that are slow growing but have good dividend history, making a DDM useless on high-growth companies like Apple or Amazon.
2. Constant Dividend Growth Assumption
The model assumes a constant growth rate for dividends. In reality, dividends may change over time, which can affect the accuracy of the valuation. The one-period DDM is less affected by this limitation since it focuses on a single period but is still a constraint.
3. No room for errors
Another drawback is the calculation requires many estimations of growth rates and required rates of return. DDM estimations can be more accurate in the case of the one-period, making the model a little easier to use.
Nevertheless, any estimations could be wrong, thus making the model worthless.
4. Excludes stock buybacks
It disregards the effects of stock buybacks. The effects of buybacks reduce the number of shares on the market, increasing each investor's ownership of the company.
Note
Stock buybacks can cause large discrepancies when stock is returned to shareholders. Thus illuminating the issue of discounted dividend models being too conservative when it is valuing a stock price.
5. Unrealistic time horizon
The One-Period DDM assumes that the investor will hold the stock for only one period. However, investors often have longer time horizons for their investments.
Ignoring the potential dividends and value of the stock beyond the first period can result in an incomplete valuation and may not reflect the true investment potential.
6. Sensitivity to the discount rate
The intrinsic value calculated using the One-Period DDM is highly sensitive to the discount rate used. Small changes in the discount rate can lead to significant variations in the estimated value.
Determining an accurate and appropriate discount rate can be challenging, as it depends on various factors, such as the risk associated with the stock, market conditions, and investor preferences.
7. Limited applicability
The One-Period DDM is most suitable for valuing stocks that pay regular dividends and have stable dividend policies. It may be unsuitable for companies that do not pay dividends or have irregular dividend patterns.
Note
The model does not account for other sources of value, such as potential capital appreciation or cash flows from non-dividend-related activities.
8. Lack of consideration for risk
The One-Period DDM does not explicitly incorporate risk factors associated with the investment. It assumes a constant required rate of return for all stocks, regardless of their risk profiles.
This simplistic approach may not accurately capture the risk-return tradeoff and can lead to inaccurate valuations, particularly for high-risk stocks.
Other Dividend Discount Model Variants
Some other variants of the Dividend Discount Model include:
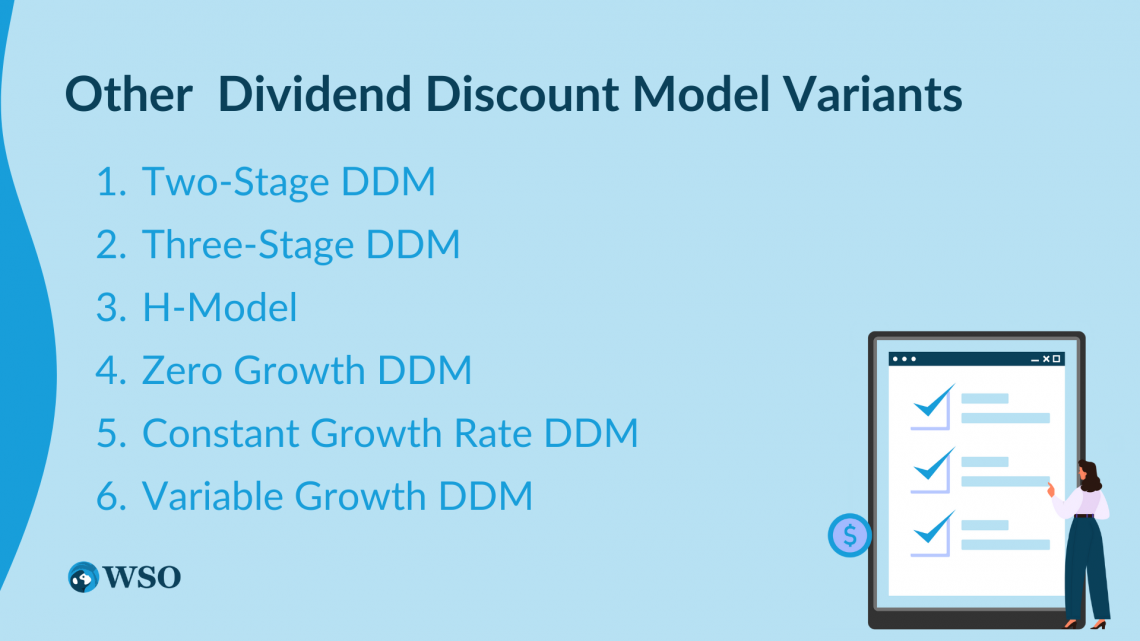
Two-Stage DDM
The two-stage DDM model recognizes that some companies may experience a period of high dividend growth followed by a period of stable growth. This model incorporates two distinct stages to reflect these different growth rates.
In the initial stage, the model considers a higher dividend growth rate, and in the subsequent stage, it assumes a more stable and sustainable growth rate. The two-stage DDM provides a more realistic valuation for companies that undergo significant growth transitions.
Three-Stage DDM
The three-stage DDM model builds upon the two-stage model by introducing a third stage, representing a terminal growth rate. This third stage assumes a long-term sustainable growth rate that continues indefinitely.
Note
The three-stage DDM is useful for valuing companies that experience multiple stages of growth, such as those in cyclical industries or with evolving business models.
It provides a more comprehensive analysis by incorporating the expected future growth beyond the initial growth stages.
H-Model
The H-model combines elements of both the two-stage and three-stage DDM models. It recognizes that the growth rate of dividends may gradually decline over time but not necessarily in distinct stages.
The H-model assumes a gradual decline until a stable and sustainable growth rate is attained. This model is particularly suitable for valuing companies with a gradual slowdown in dividend growth rather than sharp transitions.
Zero Growth DDM
The zero-growth DDM model assumes that dividend payments will stay constant and there is no growth throughout the assessed period. Calculating the stock price would equal the annual dividends divided by the required rate of return.
Intrinsic Value = Dividend Payment / Required rate of return
The formula can calculate the value of the preferred stock, which pays out fixed dividends.
Note
Owners of preferred stock know the exact amount of their dividends as they stay the same.
Constant Growth Rate DDM
A constant growth rate model assumes that the dividends increase at a fixed or constant rate over the evaluated period. The growth must be at the same rate throughout, making it a more straightforward version of a DDM. It is also known as the Gordon growth model (GGM).
Note
Mature companies, whose dividends are growing steadily, are fit for constant rate DDM.
The model assumes that the company will continue to pay out increasing dividends; therefore, to value the stock, it takes in an infinite series of dividends per share and discounts them by the required rate of return.
Variable Growth DDM
The Variable growth DDM is the most realistic model compared to the other variants.
It is used for companies with unsteady dividends, which most companies have, as everyone experiences different growth rates. The Model considers high growth, then low growth, and a constant growth period.
To calculate the constant growth period, the GGM model is used, along with two-stage and three-stage DDM models. Finally, the present value of each period is added up to create the stock's intrinsic value.
Free Resources
To continue learning and advancing your career, check out these additional helpful WSO resources:


or Want to Sign up with your social account?