Return on Capital Employed (ROCE)
It is a profitability metric that assesses how efficiently the company invests money back into the business


What Is Return On Capital Employed (ROCE)?
The return on capital employed (ROCE) is a profitability metric; it assesses how efficiently the company invests money back into the business.
It is an excellent measure of company profitability as it tells how much return the capital employed in the business generates in a given year. Also, it provides an effort to assess the company's capital efficiency.
A high and consistent ROCE tells us that the business has some competitive advantages set up, allowing them to generate higher returns on its capital.
Competitive advantage or 'moat' allows the business to generate ROCE higher than the industry average and much above its cost of capital.
A high return on capital employed also translates to higher free cash flows as the EBIT grows.
- Return on Capital Employed (ROCE) is a key metric that assesses a company's profitability by evaluating how efficiently it reinvests money back into the business.
- ROCE is an excellent indicator of a company's profitability because it shows how much return the capital employed generates in a given year.
- A high and consistent ROCE indicates that a business likely has competitive advantages or a "moat" that allows it to generate returns higher than the industry average and above its cost of capital.
- Higher ROCE is associated with increased free cash flows, especially as EBIT (Earnings Before Interest and Taxes) grows. This can be crucial for a company's financial health.
Understanding Return on Capital Employed (ROCE)
The ROCE can either be used as a standalone metric to judge the business empirically or as a relative metric to compare two similar companies.
The reason returns on capital employed are so widely used and accepted as a metric is that it is straightforward to calculate. This metric is most useful in capital-intensive companies. And, unlike any other Return metric, it also incorporates the debt in the quotient and equity.
All the components are audited and straightforward numbers. However, they are challenging to manipulate as well.
The capital employed part is all balance sheet components which are much more challenging to fabricate than the income statement.
The EBIT is more preferred to earnings as it is unaffected by line items such as tax and other adjustments to the net income. It also judges the company's ability to pay its debtors.
ROCE can be used to judge the quality and cyclicality of the business.
If ROCEs is high and consistent, then it is safe to assume that the business is either a quality business with substantial competitive advantages or has very high tailwinds and demand growth that it can consistently generate and reinvest at a very high rate.
Businesses with competitive advantages generate very high returns much above their cost of capital for extended periods.
The business is cyclical if the ROCEs constantly change with higher and lower return periods.
For cyclical industries, contraction and expansion of demand are the key drivers of returns on capital employed. On the other hand, for sectors like steel, automobile, etc., a strong economy and credit availability are crucial to generating high returns on its capital.
If the business cannot generate returns on capital above its cost of capital, it is said to have average profits. But, if the business can generate them above its cost of money, it is said to have supernormal or economic gains.
Businesses with lower capital requirements usually generate the highest returns on capital employed as they don't need as much money to drive growth. New-age technology businesses are the best examples of that.


Return On Capital Employed (ROCE) Formula
The formula of ROCE is as follows:
ROCE = EBIT/ Capital Employed
There are two components to the ROCE formula:
- Capital Employed
- Ebit
1. Capital Employed
Capital Employed = Total Assets - Current Liabilities
The capital employed is when current liabilities are subtracted from the total assets. Another way of calculating capital employed is to add the shareholder's equity and long-term liabilities.
In other iterations, the capital employed can be defined as the sum of fixed assets and working capital. Working capital is the difference between current assets and current liabilities.
2. Ebit
EBIT = Earnings Before Interest and Taxes
The earnings before interest and taxes are arrived at when the interest expenses are added back to the before-tax profits of the firm. In other words, EBIT is the income statement element that comes once the COGS and operating expenses are deducted from the revenues.
The EBIT eliminates the tax effect, making businesses with different tax regimes comparable and leaving out the interest component to account for the company's debt holders and creditors. It shows the amount remaining for the coverage of interest expenses.
ROCE also aids in judging how efficient the company is in using the capital available at its disposal.
It serves as a benchmark for evaluating management quality. The most important aspect for a business to grow is efficient capital allocation. If the managers are not good capital allocators, the company won't be able to grow.
Example of Return on Capital Employed
Let's take a few examples below.
Exhibit 1: Standard & Poors Global (SPGI) vs. Moody's Corporation (MCO)
S&P Global and Moodys are credit rating agencies based out of the United States. These are the largest credit rating agencies in the world.
They have essentially the same business and thus are very comparable.
Moody's Corporation.
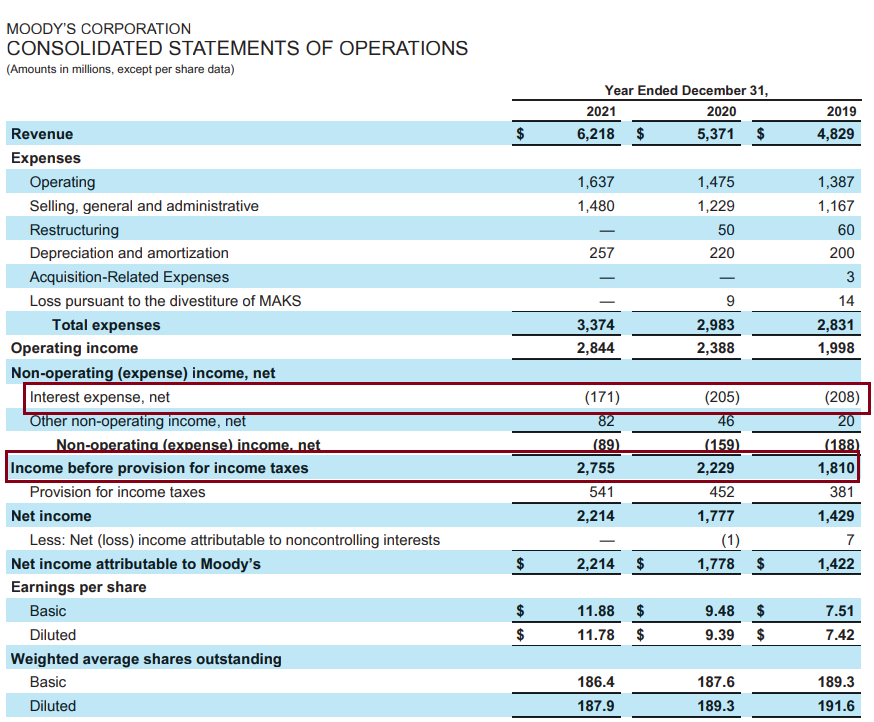
EBIT is calculated by adding interest expenses to before-tax profits.
| (Figures in million $) | 2021 | 2020 | 2019 |
|---|---|---|---|
| Before-tax profits | 2755 | 2229 | 1810 |
| Interest expense | 171 | 205 | 208 |
| EBIT | 2926 | 2434 | 2018 |
The EBIT for the year 2021 is $3 billion.
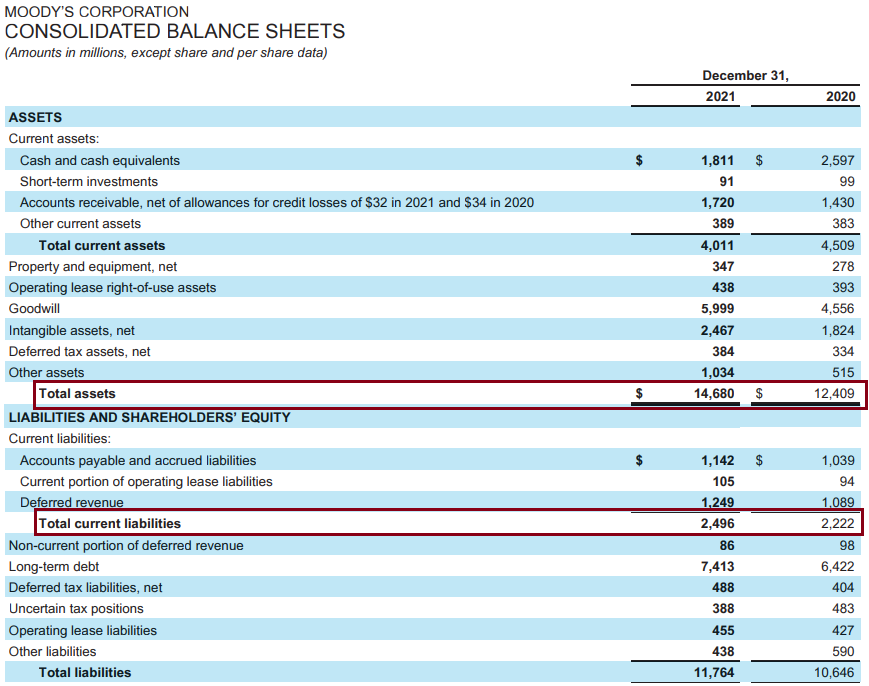
Capital employed is calculated by subtracting current liabilities from total assets.
| (Figures in million $) | 2021 | 2020 |
|---|---|---|
| Total Assets | 14680 | 12409 |
| Total Current Liabilities | 2496 | 2222 |
| Capital Employed | 12184 | 10187 |
The capital employed for the year 2021 is $12 billion.
ROCE = EBIT / Capital Employed
| (Figures in million $) | 2021 | 2020 |
|---|---|---|
| EBIT | 2434 | 2018 |
| Capital Employed | 12184 | 10187 |
| ROCE | 20% | 20% |
Moody's corp has a ROCE of 20% for the years 2021 and 2020
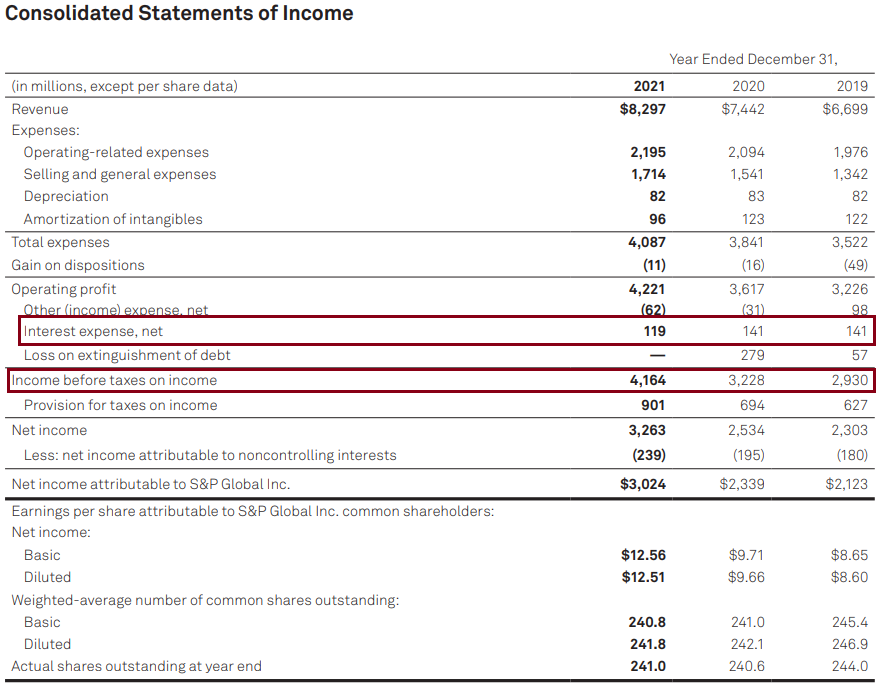
Standard & Poor Global Inc.
| (Figures in million $) | 2021 | 2020 | 2019 |
|---|---|---|---|
| Before-tax profits | 4164 | 3228 | 2930 |
| Interest Expense | 119 | 141 | 141 |
| EBIT | 4283 | 3369 | 3071 |
S&P Global has an EBIT of $4.2 billion for 2021
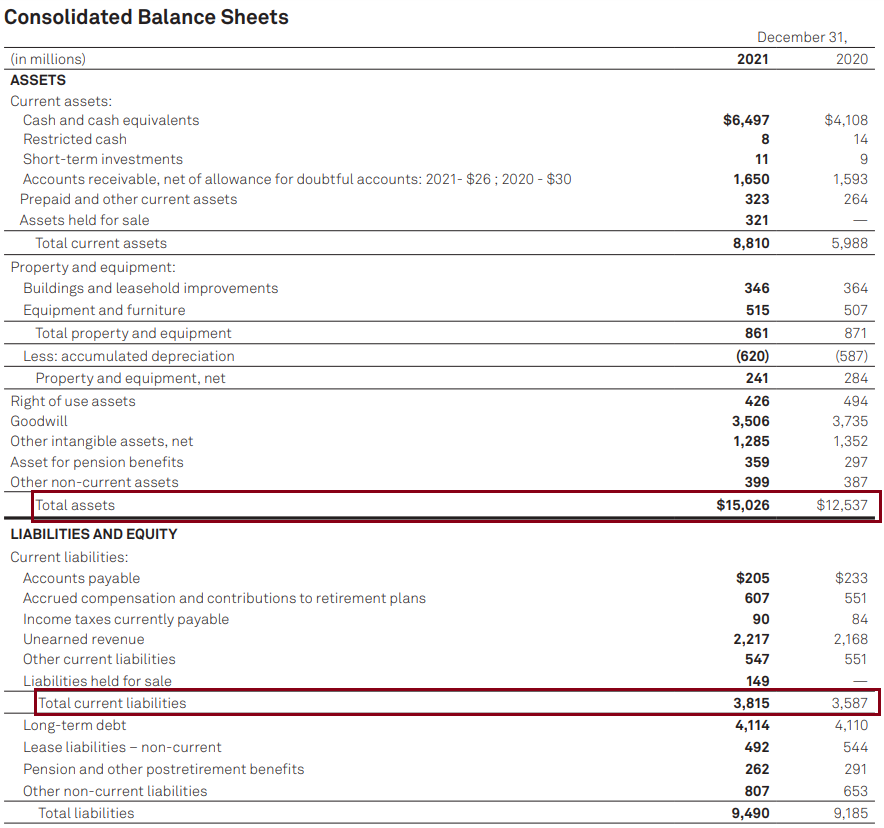
Capital Employed:
| (Figures in million $) | 2021 | 2020 |
|---|---|---|
| Total Assets | 15026 | 12537 |
| Total Current Liabilities | 3815 | 3587 |
| Capital Employed | 11211 | 8950 |
Capital employed was $11.2 billion for the year 2021
ROCE = EBIT / Capital Employed
| (Figures in million $) | 2021 | 2020 |
|---|---|---|
| EBIT | 4283 | 3369 |
| Capital Employed | 11211 | 8950 |
| ROCE | 38% | 38% |
S&P Global has shown a return on capital employed of 38% for the years 2021 and 2020.
Comparing the two companies, it is clear that S&P is the superior firm; it has lower capital employed than Moody's for both 2020 & 2021 and yet has generated almost twice the EBIT.
This means their Capex requirement is much lower because of their competitive advantages.
When we look at the valuation of these firms, we can see
Both companies are trading at similar valuations despite S&P having a clear competitive advantage with higher capital returns.
S&P Global is cheaper than Moody's despite having similar valuations due to its superior returns on capital employed.
Exhibit 2: Johnson & Johnson (JNJ) vs. Pfizer Inc. (PFE)
Johnson & Johnson and Pfizer are two of the largest pharmaceutical companies in the world
Johnson & Johnson
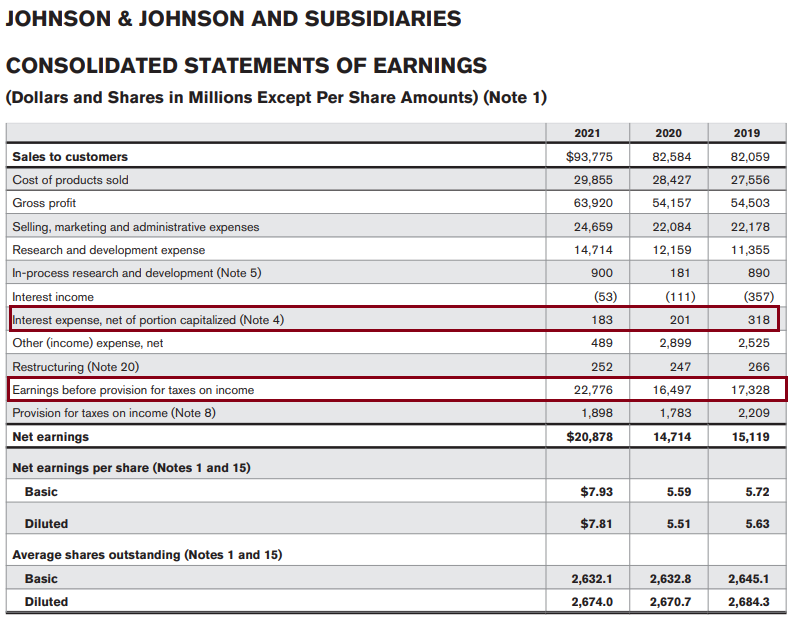
| (Figures in million $) | 2021 | 2020 | 2019 |
|---|---|---|---|
| Before-tax profits | 22776 | 16497 | 17328 |
| Interest Expense | 183 | 201 | 318 |
| EBIT | 22959 | 16698 | 17646 |
JNJ has an EBIT is $23 billion for 2021
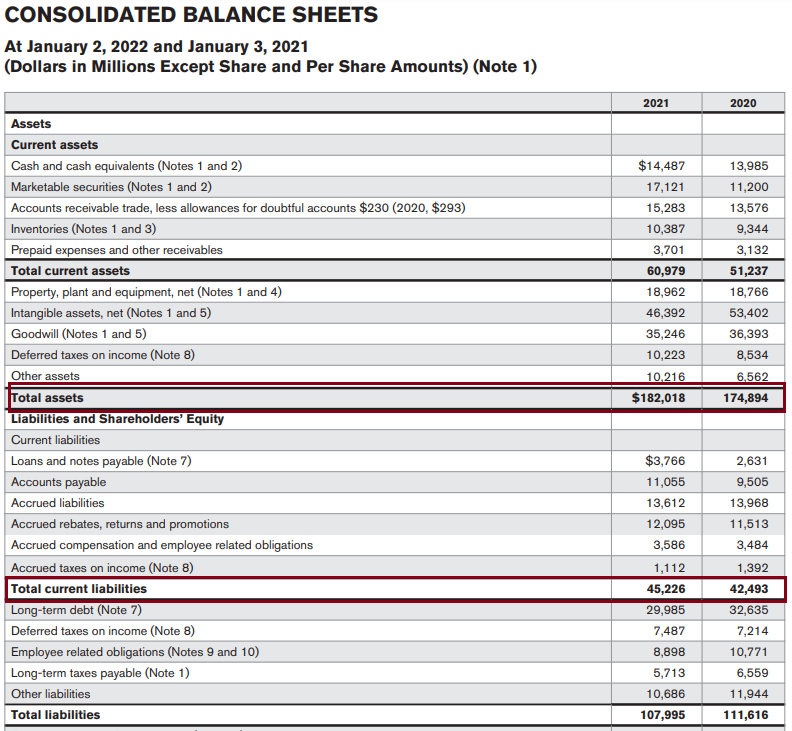
| (Figures in million $) | 2021 | 2020 |
|---|---|---|
| Total Assets | 182108 | 174984 |
| Total Current Assets | 45226 | 42493 |
| Capital Employed | 136882 | 132491 |
| (Figures in million $) | 2021 | 2020 |
|---|---|---|
| EBIT | 22959 | 16698 |
| Capital Employed | 136882 | 132491 |
| ROCE | 16.77% | 12.62% |
Pfizer
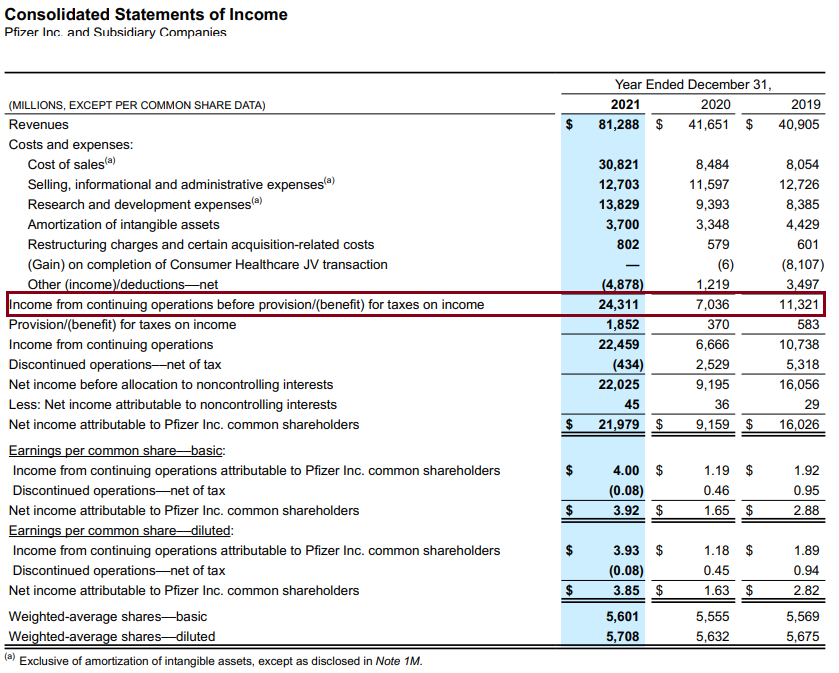
Pfizer has not shown any interest expense on its income statements, so before tax profits, the EBIT
| (Figures in million $) | 2021 | 2020 | 2019 |
|---|---|---|---|
| Before-tax profit / EBIT | 24311 | 7036 | 11321 |
Pfizer has an EBIT of $24 billion for 2021.
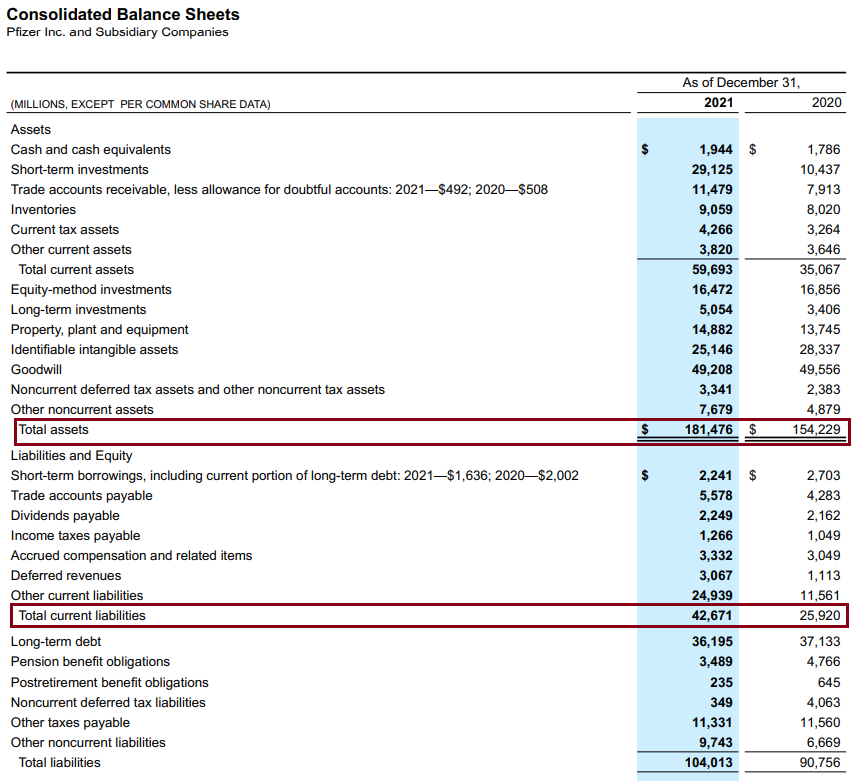
| (Figures in million $) | 2021 | 2020 |
|---|---|---|
| Total Assets | 181476 | 154229 |
| Total Current Liabilities | 42671 | 25920 |
| Capital Employed | 138805 | 128309 |
Pfizer has a capital employed of $138 billion for 2021
| (Figures in million $) | 2021 | 2020 |
|---|---|---|
| EBIT | 24311 | 7036 |
| Capital Employed | 138805 | 128309 |
| ROCE | 17.51% | 5.48% |
J&J has a return on capital employed of 16.77%, and Pfizer stands slightly higher at 17.51%. But JNJ had shown a higher ROCE in the past, while Pfizer has not been able to generate that level of return on its capital in 2020.
At the same time, JNJ boasts a higher valuation than Pfizer at a P/E of 22, while PFE only has a P/E of 10.
The two firms can be said to be valued relatively because Johnson & Johnson has more consistent returns on its capital, it can be argued that Pfizer is undervalued looking at the drastic improvement of its return ratios, but they need to sustain to give the stock a premium.
Return on Capital Employed (ROCE) vs. Return on Invested Capital(ROIC)
ROIC & ROCE are metrics used to judge the profitability of the business. There has been a long-standing argument on which metric is better suited to feeling the actual profitability of a business. ROIC is calculated by dividing invested capital by the net operating profits after taxes (NOPAT).
NOPAT is EBIT after cash taxes are deducted from it.
ROIC = NOPAT/ Invested Capital
NOPAT = Earnings Before Interest & Taxes * (1 - Tax Rate)
There are several approaches for calculating the invested capital. One approach considers invested capital as the non-cash net working capital added to fixed assets.
Invested Capital = Fixed Assets + (Current Assets - Current Liabilities - Cash)
Another approach is to use the company's total debt and equity as invested capital.
Invested Capital = Debt + Equity
But this approach is similar to the ROCE formula with the difference in the inclusion of short-term debt.
Two other methods build upon the previous formulas:
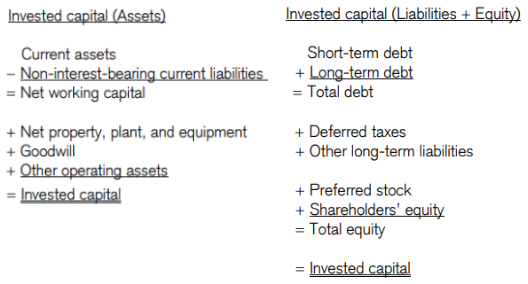
ROCE & ROIC are very similar ratios; ROCE uses capital employed, and the business's total assets are subtracted from the current liabilities. Therefore, the long-term debt and total equity can alternatively calculate; it will have the same numerical result.
The capital employed is a much broader metric that encompasses long-term debt and equity, the money the business uses.
ROIC, on the other hand, is a more advanced metric. A significant difference is that ROIC used NOPAT is believed to be a better metric than the EBIT as it encompasses cash taxes which is another thing that differentiates the two ratios.
The exclusion of taxes makes businesses with different tax regimes comparable.
ROIC is a much more flexible metric that can be calculated in many different formulas; its versatility makes it more widely accepted than the return on capital employed.
On a comparative basis, the metrics are very similar; ROCE captures a broader metric and is more comparable due to ignoring cash taxes.
ROIC, on the other hand, is a more focused and dynamic metric that can be altered and changed according to different businesses. Even though it includes taxes, corporate tax rates are more or less similar countrywide, with some exceptions.
Return on Capital Employed (ROCE) FAQs
The primary purpose of ROCE is to assess a company's profitability by evaluating how efficiently it reinvests money back into the business. It measures how much return the capital employed generates in a given year, making it an essential metric to gauge the company's capital efficiency.
A high and consistent ROCE suggests that a business likely possesses competitive advantages or a "moat." This allows it to generate returns higher than the industry average and above its cost of capital.
Such businesses can generate higher free cash flows as EBIT grows, contributing to their financial health and long-term success.
ROCE is calculated using the formula: ROCE = EBIT (Earnings Before Interest and Taxes) / Capital Employed. Capital Employed is determined by subtracting current liabilities from total assets.
It represents the funds invested in the business. EBIT is the income before interest and taxes, making it a reliable indicator of a company's operating performance.
ROCE and ROIC are similar metrics but have subtle differences. ROCE uses capital employed, which considers total assets minus current liabilities. On the other hand, ROIC uses invested capital, which can vary in its definition but often includes long-term debt and equity.
ROIC is considered more flexible and can incorporate taxes, making it suitable for comparing companies with different tax regimes. ROCE, while similar, focuses on capital efficiency and is more straightforward in its calculation.

Researched and authored by Aditya Salunke I LinkedIn
Free Resources
To continue learning and advancing your career, check out these additional helpful WSO resources:


or Want to Sign up with your social account?