Bullish Engulfing Candlestick
Is a two-candlestick chart pattern that is typically seen in technical analysis.


What Is a Bullish Engulfing Pattern?
The bullish engulfing pattern is a two-candlestick chart pattern that is typically seen in technical analysis. It usually indicates a potential reversal in the current downtrend and a possible uptrend in the future.
The pattern consists of two candles. The first candle is bearish, which means it closes lower than its open price and is red in color.
The second candle is a larger bullish candle that completely engulfs the body of the first candle, closing higher than its open price, even though this candle opened below the previous period’s closing price. Such a candle is represented by green color.
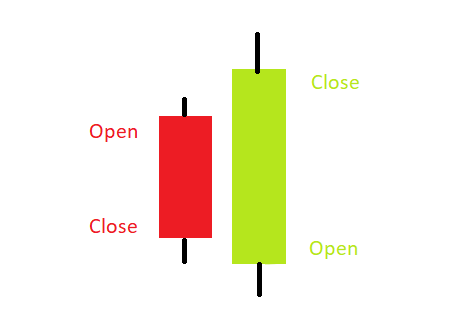
The image above shows what a bullish engulfing pattern, which is formed across two periods, looks like. As you can see, the candle on the left-hand side is a bearish, red candle, whereas the candle on the right is a long, green, bullish candle that completely engulfs the red candle.
The bullish engulfing pattern is considered more reliable when it occurs after a downtrend, as it suggests that buyers are gaining control of the market and may lead to a reversal in trend.
Also, experts believe that a bullish engulfing pattern is much more reliable and can predict a trend reversal more accurately when it is preceded by at least four red candlesticks.
Therefore, it is critical to look not only at the two candlesticks formed in the pattern but also at the candlesticks formed prior to the pattern.
Traders use the bullish engulfing pattern to identify potential buying opportunities, which may indicate that the market sentiment is changing from bearish to bullish.
- A bullish engulfing pattern is a two-candlestick chart pattern indicating a potential trend reversal.
- It occurs after a downtrend, with the first candle being bearish (red) and the second being a larger bullish (green) candle that completely engulfs the first.
- This pattern is highly reliable when it appears following a sustained downtrend. It signals a shift from bearish to bullish sentiment in the market.
- Bullish engulfing patterns reflect a sudden bullish surge after a downtrend, signaling discomfort for bears.
Trade Setup with a bullish engulfing pattern
Certain conditions must be met for any candlestick pattern formation to ensure that the pattern is valid and reliable. For example, the following are the conditions that must be met for the bullish engulfing pattern to work:

- The trend before the pattern formation should be a downward trend.
- At the bottom of the downtrend, there should be a red candlestick (R1). This implies that the opening price of the period represented by R1 was greater than the closing price.
- The period next to this red candle must be represented by a green candlestick (G1). A green candle will imply that the opening price of the underlying was lower than the closing price for the period represented by that particular candlestick.
- The opening price for G1 must be below the closing price of R1. However, the closing price for G1 must be above the opening price for R1. Also, G1 must be long enough to engulf R1 completely.
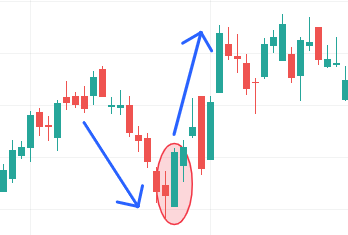
- The encircled candles in the above image accurately describe a bullish engulfing pattern since all the necessary conditions mentioned above that are required for the pattern formation are met.
- Once the trader confirms the existence of the candlestick pattern, they may look for buying opportunities. Ideally, the trader would look to buy the underlying near the closing price of G1.
- To be sure, a trader can also confirm with the help of other technical indicators such as MACD, RSI, EMA crossover, volume, etc.
Note
Take the trade only after the candle is wholly formed. Do not take a trade in anticipation of a candlestick pattern formation.
Example of a Bullish Engulfing Pattern
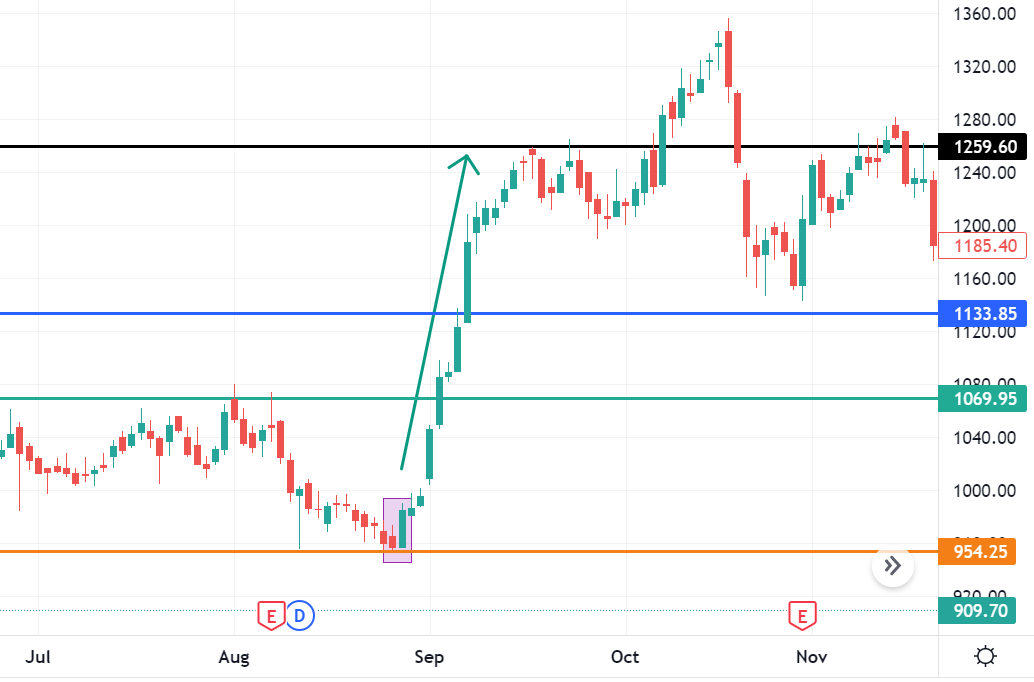
Let us now try to practically apply everything we learned above to pick up a trade in the stock market. Below is a visual representation of the technical chart of Voltas Ltd. (A company listed on the Indian stock exchange, NSE).
Keep in mind that this is a daily chart, meaning each candle represents one trading session or one day’s trading action.
As you can see, the red arrow shows a downtrend, showing how the price of the underlying has been declining. The rectangle highlights the formation of a bullish engulfing pattern.
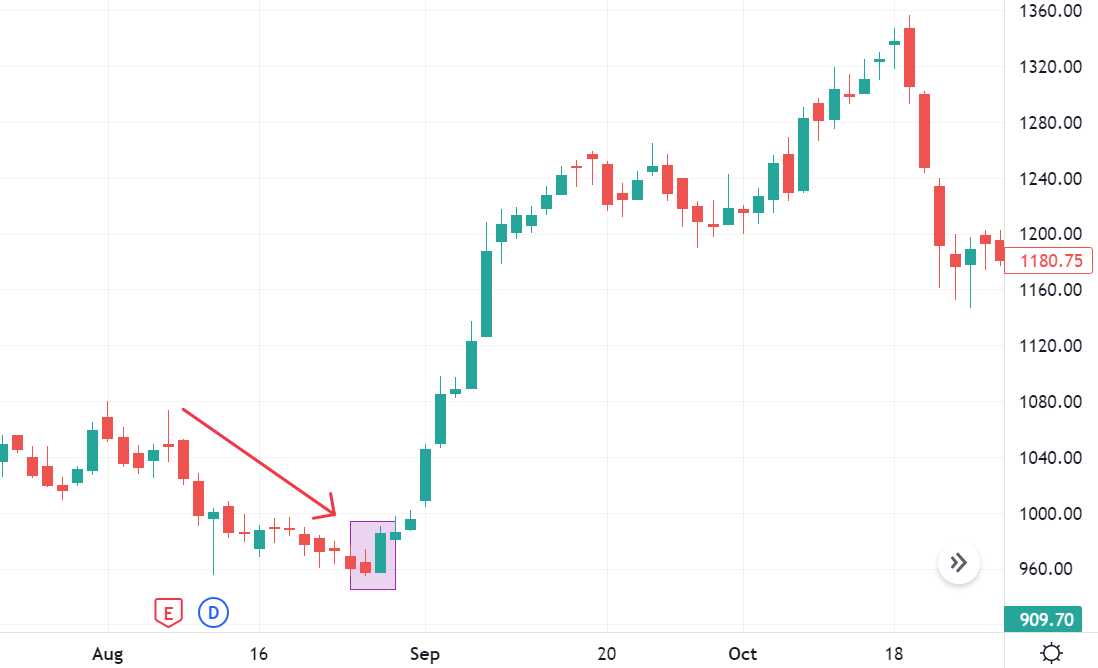
On day 1 of the candlestick pattern, we see that the price opens near 964 INR. However, by the time the closing bell rings, the price of the underlying is near 957 INR. Hence, a red candle (R1) is formed, continuing the downward trend.
On day 2 of the pattern formation, the opening price is around INR 956 (slightly below the closing price of R1).
However, as the day passes, we see bulls taking a strong grip on the stock. The closing price for Voltas Ltd. on day 2 of the pattern is approximately INR 985, well above the opening price of R1. A long green candle (G1) is formed as a result.
Once the pattern formation is confirmed (a trader can confirm the candle formation about 10-15 minutes prior to the closing bell), a trader can look to buy shares of Voltas Ltd. at nearly INR 985.
It is vital now to set a stop loss. Generally, traders choose the lowest low of the two-day pattern as their stop loss. In the current scenario, the lowest low that the pattern makes is INR 954.25 (R1 has a very tiny wick below it that touches the 954.25 price level).
Professional traders also generally choose to set targets beforehand. This can be done by choosing support and resistance levels on the price chart of the underlying. In the given chart, we can determine our first target as 1069.95 and the second target as 1133.85.
Note
Setting targets for a trade requires practice and a few extra sets of skills, such as identifying support and resistance zones and using tools like Fibonacci retracements.
So, we can derive the following trade setup:
- Entry: INR 985
- Stop Loss: INR 954.25 (represented by the orange line)
- Targets:
- Target 1 (T1) → INR 1069.95 (represented by the green line)
- Target 2 (T2) → INR 1133.85 (represented by the blue line)
As you can see, the trade proved to be a successful one. We reached our targets, T1 and T2, quite easily.
A risk-averse trader may choose to book profits once the price touches T1. For this trader, the profit is equal to (1069.95-985) or INR 84.95 per share.
A trader looking for higher profits may choose to hold onto the trade till T2, and this trader may set a trailing stop loss as per their convenience. On reaching the second target, the trader earns a profit of (1133.85 - 985) or INR 148.85 on each share that they bought.
Also, keep in mind that the maximum loss potential for the trade is (985 - 954.25) or INR 30.75 per share. Therefore, the potential for profits is much larger than the potential for loss.
By now, you must have noticed that the price even breaches the T2 mark and rallies to INR 1259 (represented by the black line).
However, such movements are highly unpredictable, and it is not easy to time the markets to ensure that you can buy low and sell high. That is why it becomes critical to set targets, book profits, and trail stop losses.
Note
Bullish engulfing pattern is one of the most reliable patterns for traders, but it is not a guarantee of success. Traders should use candlestick patterns in conjugation with other trading tools to get further confirmation.
Trading Psychology Behind Bullish Engulfing Pattern
Candlestick patterns are formed by the interaction of buyers and sellers in the market, and understanding the psychology behind these patterns can help traders make better judgments. Below is the psychology behind the bullish engulfing pattern:

- The underlying asset’s price has been declining for a few periods, and there exists a downtrend.
- In the first period of the pattern, the underlying opens low and makes a new low. As a result, we see a red candle forming.
- The underlying opens even lower in the next period, near the closing levels of the red candle formed in the previous period, and tries to set a new bottom.
- Yet at this low point in the day, there is an unexpected purchasing demand, which causes the prices to close higher than they were at the start of the previous period. This price movement results in a green, bullish candle.
- The price movement in the second period also implies that bulls attempted to break the negative trend quite abruptly and strongly, and they were largely successful. The lengthy bullish candle formed in the second period clearly demonstrates this.
- The bears would not have anticipated the quick movement of the bulls in the second period. Therefore this action by the bulls makes the bears a little uneasy.
- The next few trading periods are anticipated to be optimistic, which will drive up prices. Therefore traders should search for opportunities to purchase.
Another key aspect of understanding trading psychology is to add volume data along with the candlestick patterns. When volumes are high, it indicates that institutional investors, who have huge sums of capital, are making trades.
Therefore, a trade going your way is more likely if you can confirm candlestick formation along with high volumes.
Bullish Engulfing Pattern FAQs

There are many reliable bullish candlestick patterns apart from bullish engulfing.
Some of them, such as ‘the bullish harami’ and ‘the piercing pattern,’ form across a span of two periods, whereas patterns like ‘three white soldiers’ and ‘the morning star’ form across three periods. Some patterns, such as ‘the hammer’ formation, form within a single period.
A bearish pattern, called the bearish engulfing pattern, is often regarded as the inverse of the bullish engulfing pattern.
Like bullish engulfing, bearish engulfing too forms across two periods, but the bearish engulfing pattern is found at the top of an uptrend. The first candle in this pattern is a small green candle, whereas the second candle is a large red candle that completely engulfs the green candle.
Traders use the bearish engulfing pattern to identify potential shorting opportunities, which may indicate that the market sentiment is changing from bullish to bearish.
Using other technical indicators alongside candlestick patterns is always the better way to pick a trade since doing so can help you doubly confirm your trade.
One can use tools like RSI, volume data, MACD, EMA, etc., alongside bullish engulfing. If these indicators too suggest that there is a possibility of an up-move, then you have doubly confirmed your trade with the bullish engulfing candlestick.
The limitations of a bullish engulfing candlestick are:
1. False signals
Like any other technical analysis tool, the bullish engulfing pattern is not infallible and can produce false signals.
2. Not applicable in all markets
The bullish engulfing pattern is most effective in markets with strong trends and may not work as well in range-bound or choppy markets.
3. Ambiguous interpretation
The bullish engulfing pattern can be interpreted in different ways, depending on the context and the timeframe. For example, a bullish engulfing pattern on a daily chart may not be as significant as a bearish engulfing pattern on a weekly chart.


or Want to Sign up with your social account?