Dispersion
A statistical measure that reveals an investment's range of potential outcomes based on the historical volatility of returns.


What Is Dispersion?
Dispersion is a statistical measure that assesses the variability of the returns on a given asset, indicating the level of unpredictability or the risk associated with the asset. It is the range of possible outcomes for investment returns.

The concentration trend indicator is one characteristic of the data, and another characteristic of the data is the dispersion degree indicator.
In statistical analysis, the dispersal indicator can indicate how representative the concentrated trend indicator is and can also be used to calculate the magnitude of error when making statistical inferences.
In addition, dispersal indicators are also used to illustrate the equilibrium, rhythm, and stability of things in the process of development and change.
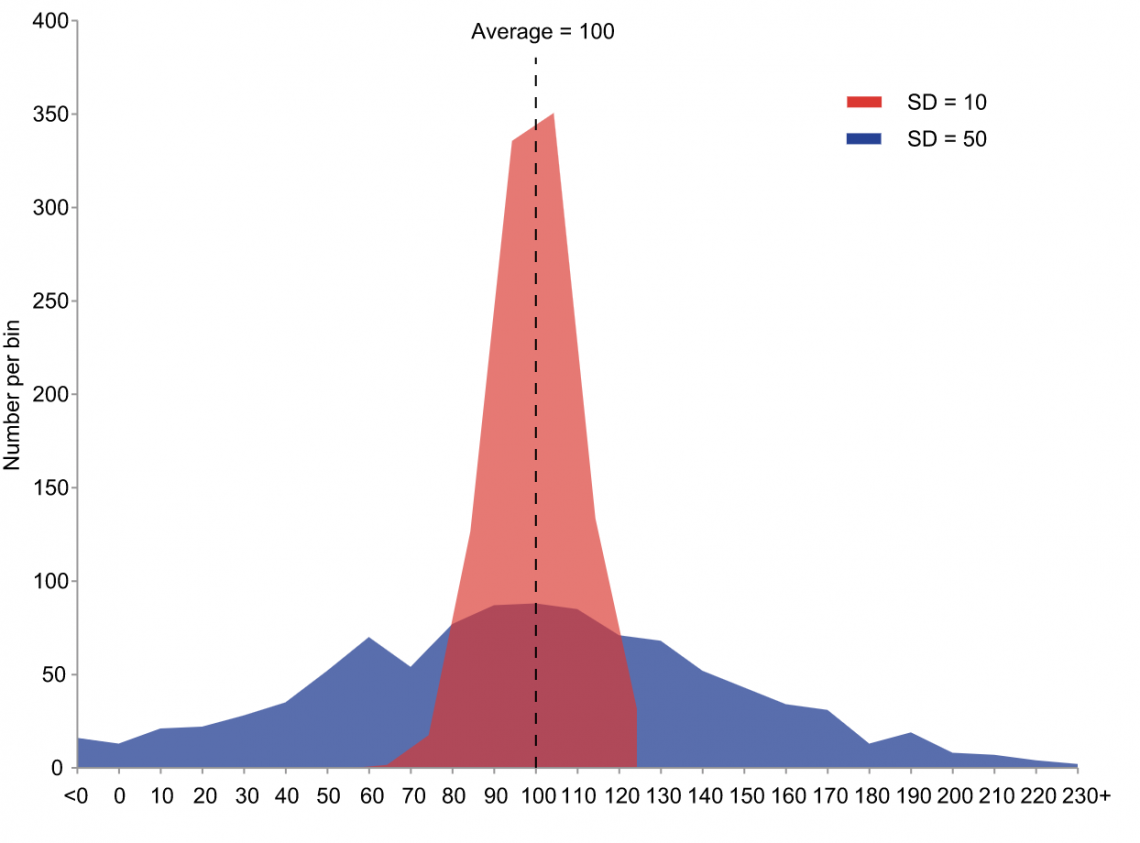
For example, if there are two sets of data, the first set is 18, 20, 22, and the second set is 15, 20, 25, we would not be able to distinguish the difference between the two sets of data based only on the mean value. But clearly, there is a difference between the two sets of data.
In this case, it is necessary to use the dispersion index to describe which group has a greater dispersal.
Diversification in investing and finance refers to an item’s range of possible returns. Many investors analyze diversification to measure the risk present in a security or investment.
It reveals an investment's range of potential outcomes based on the historical volatility of returns. In general, the higher the dispersal, the greater the risk of an investment. Conversely, the lower the dispersal, the lower the risk of an investment.
- Dispersion in finance refers to the range of potential outcomes for investment returns, indicating the level of uncertainty or risk associated with those returns.
- Dispersion is a key statistical measure used to assess the distribution of returns. Other measures of dispersion are range, variance, and standard deviation, each providing different insights into the data.
- Understanding dispersion helps portfolio managers assess risk and make informed decisions. A higher dispersion indicates greater uncertainty and risk, while a lower dispersion suggests more stable returns.
- Dispersion is crucial for diversification strategies. By combining assets with different levels of dispersion, investors can potentially reduce overall portfolio risk and achieve more stable returns.
Understanding Dispersion
We want to explain diversification and generally obtain information by measuring the degree of risk of a particular security in a given portfolio.
In the market, there are thousands of stocks for investors to choose from. When choosing an investment, investors consider many factors. These include risk profiles. Diversification can give insight.
The dispersion coefficient is essentially the magnitude of the standard deviation relative to the mean. Therefore, when comparing the relative dispersal of two data sets with different means, it is more accurate to use the dispersal coefficient than to use the standard deviation.
For example, suppose there are two workers, A and B. A produces an average of 40 parts per hour with a standard deviation of 5. B produces an average of 80 parts per hour with a standard deviation of 6. So what is the better stability of taking a worker?
According to the definition of standard deviation, the smaller the standard deviation, the smaller the dispersion, so A production is more stable than B. However, we see that B's standard deviation is slightly higher than A's, producing twice as much as A's capacity.
That is, the variation of 6 for 80 is less than the variation of 5 for 40, and this variation is the dispersal coefficient.
How to Measure Dispersion?
Determining the most representative value of a data set requires measuring the central tendency of the data, which is the center of the distribution.
To better describe the data, it is also a better choice to measure the distribution of the data around the center of the distribution. This measurement is called a dispersal measure. The most commonly used dispersal measures are:
- The range is the difference between the highest value and the smallest value;
- The interquartile range is the range of the 50% of data that is central to the distribution;
- The variance is the mean squared distance between each point and the center of the distribution;
- The standard deviation is the square root of variance.
Additionally, there are two other ways to measure dispersion.
Alpha
Alpha can measure the statistics of a portfolio's risk-adjusted return is how much, more or less, the investment returned relative to the index or beta.
The success of a portfolio manager or model resulting in returns above beta indicates positive alpha. On the other hand, a negative alpha indicates a portfolio manager's lack of success in beating the beta or, more broadly, the market.
Beta
The dispersal of a security's return relative to a particular benchmark or market index can be measured by beta, a primary risk measurement statistic, most commonly the U.S. S&P 500. A beta of 1.0 indicates that the investment is in line with the benchmark.
The stock may experience more volatility than overall, which makes the beta greater than 1.0 - the stock may experience 1, 3 times more than the market.
In this case, the beta is 1, meaning that if the market goes up by one, the stocks with a beta of 1.3 will go up 13%.
Conversely, if the market falls, the security may decline more than the market, although there is no guarantee of the magnitude of the move.
A beta of less than 1.0 implies less dispersal of market returns. If a stock's growth is lower than the growth of the overall market, it will grow much less.
Dispersion in Different Fields of Study
In physics, dispersible flocs or droplets of solid particles in water or other homogeneous liquid media can be dispersed into fine particles suspended in the dispersal medium without precipitation properties.
The dispersibility is related to the specific surface area of the substance, and a large specific surface area results in good dispersibility. Therefore, dispersion is commonly used to indicate the dispersibility of a substance.
According to the size, it is divided into molecular dispersal (dispersion particle size less than 10-7 cm), colloidal dispersal (dispersion
particle size 10-7 to 10-5 cm), and coarse dispersal (dispersal particle size in 10-5 to 10-3 cm, such as milk, slurry, etc.).
In chemistry, thermal classification techniques are used to study the crystallization sequence of ethylene copolymers. Polydispersity is a typical characteristic of soft substances, and the strength properties of soft substances are determined by the polydispersity (rise and fall) of the system.
Polymers are soft substances. The polydispersity of its primary structure must necessarily affect or be reflected in the polydispersity of the structure and properties of its aggregated state.
The polydispersity of the crystalline sequence length of crystalline olefin copolymers is manifested in the fact that samples with close or identical copolymer compositions may have very different molding processing and use properties.
Fluctuations in the control of polymerization conditions determine and influence the polydispersity of crystalline sequence length in crystalline olefin copolymers. Therefore the polydispersity of crystalline sequence length in olefin copolymers is studied.
Reasons for Industry Fragment
In the business industry there are many reasons why an industry becomes fragmented, both historical and economic. Here are the main causes:
- Low barriers to entry: With low entry barriers in an industry, it is easier for firms to enter such an industry. As a result, many SMEs have become dominant competitive forces in the industry.
- Lack of economies of scale: Some industries have relatively simple production processes, making it difficult to implement effective mechanization and standardization. In such enterprises, although the production scale will continue to expand, their costs do not decline, or the decline is small.
- At the same time, the high cost of storage and the irregular changes in sales make it difficult for enterprises to play the role of economies of scale. Therefore, to some extent, less specialized firms are more competitive than large capital-intensive firms with a high degree of specialization.
- High degree of product differentiation: A high degree of product differentiation can effectively limit the size and allow for developing companies with different efficiencies.
- Inadequate bargaining power: In a fragmented industry, the supply-side and buy-side structure dictates that firms do not have bargaining power when dealing with neighboring firms or units.
- At the same time, the supply side and the buying side consciously encourage new firms to enter the industry, keeping the industry fragmented and keeping firms small.
- High transportation costs: High transportation costs often limit the effective production scale of enterprises, as well as production layout, so the industry can not form an overall scale effect.
- Diversity of market demand: In some industries, customer demand is fragmented and takes many forms due to geographical differences. As a result, this leads to industry fragmentation.
- The initial stage of the industry: In the early stage of industry development, all companies are growing and cannot expand production or merge. Therefore, the industry is in a fragmented state at this time.
- In response to the industry’s fragmented state, both theoretical and practical communities are exploring strategies and methods to integrate the industry, trying to change the fragmented industry structure and use basic competitive strategies to gain a competitive advantage.
Forms of Strategies
There are three forms of strategies commonly used by companies:
1. Chain of operations
Companies use this method mainly to gain the strategic advantage of cost leadership.
Chain operation changes the previous state of the scattered layout of retail stores, establishes a network of contacts, creates economies of scale, and has a large purchasing power.
At the same time, chain operations can establish regional distribution centers, overcome high transportation costs, reduce inventory costs, respond quickly to store and customer needs, and share common management experiences.
All these can significantly reduce the cost of business and form a competitive advantage.
2. Franchising:
Companies want to create differentiation and gain a competitive advantage by franchising more often in a decentralized industry.
In franchising, a local business is owned and managed by one person, both owner and operator, who can handle the business with a strong commitment to maintaining product and service quality, meeting customer needs, and creating differentiation.
By franchising, a company can also mitigate rapidly increasing financial expenses and gain the economic benefits of large-scale advertising, distribution, and management, allowing for rapid growth.
To seek growth, firms merge small and medium-sized enterprises in some industries at the operational level to form large enterprises.
For example, some local firms are merged into national firms to create economies of scale or form a national market, so firms can adopt cost leadership or differentiation strategies.
Diversifying industries can present strategic opportunities for firms to make choices and failures.
Points to Consider In Dispersion
In the use of the strategy, companies should pay attention to the following points:
- Avoid a full-scale attack: In a fragmented industry, it is difficult for companies to face all customers, produce and operate a variety of products and provide a variety of services.t is difficult to achieve success, but it can weaken the competitiveness of the company.
- Avoid randomness: In strategy implementation, companies should not constantly be adjusting their previous resource allocation. In the short term, frequent adjustments may produce results, but in the long term, strategy implementation that is too random will destroy its resources and weaken its competitiveness.
- Avoid too much decentralization: In a decentralized industry, the key to business competition is to respond to changes in demand in production operations. Therefore, in terms of organizational structure, enterprises should make appropriate choices.
- A centralized organizational structure is less responsive to the market, and operating unit managers have little initiative to adapt to competition in a decentralized industry.
- Avoid overreacting to new products: In the decentralized industry, new products will constantly appear, and companies that overreact without considering their strengths will weaken their competitiveness.
Dispersion FAQs
It is defined as the propagation of white across its entire wavelength spectrum. More technically, scattering occurs whenever light propagation is wavelength-dependent.
Scatter in statistics is a means of a set of data. When a group of data has a wide range of numerical walks, it can be observed that the data set has a large value. When small, the overall elements are tight.
The scatter around the central value is essential to the primary tendency measurement. This part describes the spread around the central value and its variation. This method mainly estimates a data set's 'normal' value.

Free Resources
To continue learning and advancing your career, check out these additional helpful WSO resources:


or Want to Sign up with your social account?