Mean Reversion
The theory suggests that asset prices will eventually return to their long-term average price


What Is Mean Reversion?
Mean reversion is a concept in trading that suggests asset prices tend to return to their average or long-term price over time. In simpler terms, if a stock or asset experiences a significant price change, it is likely to move back toward its usual value in the future.
The stock market can be overwhelming, especially for new traders. With numerous companies available, choosing the right ones can be challenging. This is where choosing proper trading strategies comes into place, and Mean Reversion is considered by many investors a great strategy when making a trading decision.
According to mean reversion, asset prices will eventually return to their long-term average. This means that if a stock's price deviates significantly from its usual value, it is expected to revert to that value in the future.
The mean reversion strategy aims to take advantage of extreme price changes in an asset. If a stock's price is too high, investors may sell it to secure profits before it returns to its original value. On the other hand, if the price is too low, investors may buy the asset, anticipating its rise back to the original value.
Investors use mean reversion to make buy or sell decisions for securities. It's crucial to note that this strategy is not limited to stocks; interest rates and price-to-earnings ratios can also be subject to reversion.
The mean reversion theory has led to the creation of various investment strategies. These strategies aim to help investors outperform the market by identifying securities whose performances deviate from their historical averages.
- Mean reversion theory suggests that asset prices will eventually revert to their long-term average price, forming the basis of a trading strategy.
- The mean reversion strategy aims to profit from extreme price changes. Investors sell overpriced assets and buy undervalued ones, anticipating a return to the average price.
- Mean reversion strategies include intraday trading, pairs trading based on correlated assets, and Forex strategies using indicators like PPO and MACD.
- The random walk phenomenon, where stock prices lack distinctive patterns, can render mean reversion ineffective, making historical data unreliable for predictions.
Trading with Mean Reversion
Let us look at the figure below to understand the theory and strategy better.
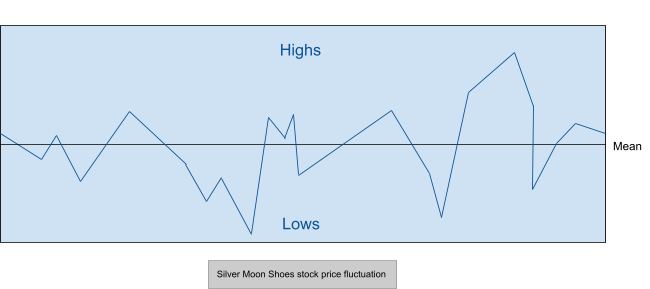
The above graph is a hypothetical depiction of the fluctuation in the stock price of a company called ‘Silver Moon Shoes.’ The company’s share price has relative highs and lows but tends back to the mean.
Now, we will consider the case of two traders, Paisley and Arya, who wish to profit from Silver Moon Shoes’ stock.
1. Buying shares at a low price
Suppose Silver Moon Shoes’ stock price is $5 per share in November. However, historical data suggests that the company’s long-term average share price is $10. Paisley knows this and uses her knowledge to buy 20 shares from the company.
Paisley will hold on to her shares until December, when the price reverts to its average value of $10 per share. In this way, Paisley will have earned $200 ($10 * 20 shares) while only spending $100 ($5 * 20 shares). She thus makes a profit of $100 ($200 - $100).
2. Selling shares at a high price
We now consider another investor, Arya. She holds 20 shares in Silver Moon Shoes, bought at $10 per share.
Suppose, in 2020, the company’s stock price skyrockets to $15 per share, and Arya can sell her holdings in the company to earn a profit. This way, she will have made $300 ($15 * 20 shares) while only spending $200 ($10 * 20 shares).
Therefore, Paisley and Arya make profits using the mean reversion trading technique.
Mean Reversion Strategies
There are several ways in which it can be used to benefit from price fluctuation in the markets. The following section discusses a few of those strategies.
1. Intraday Strategy
Multiple assets are purchased and sold within one trading day. This strategy performs best when there is a clear pattern that the companies’ stock prices follow.
2. Pairs Trading
This strategy relies on a strong correlation between the price movements of two different assets. When prices deviate, the trader can buy the asset selling for less and short the better performing one. When the prices begin to align, the trader earns a profit.
3. Forex Strategy
More often than not, this strategy is used by forex traders. It considers how far away from the mean the price of an asset deviates before it converges back to the average.
This can be done via a Percentage Price Oscillator (PPO) or Moving Average Convergence Divergence (MACD)(for better understanding see the video).
Traders may choose to enter a short or long position as the asset price rises or falls relative to an ordinary reversal level on the PPO or MACD to attain profits. Since the profit target is dynamic, traders may choose to revise it after each price bar completes.
Random Walk
The mean reversion strategy sounds appealing. However, there are situations where it may fail you.
A random walk is one such phenomenon where this trading strategy may not work.
In this occurrence, stock prices follow a trajectory that appears to have no distinctive patterns instead of reverting to the long-term mean. This fluctuation, independent of historical price data, is called the “random walk.”
This means that past price movements have no impact on their future level. Hence, relying on historical data is nearly impossible to beat the market. Therefore, investors must take on additional risk to profit from arbitrage.
The random walk also denounces fundamental analysis as predictive of stock market movements. This is because the information collected can sometimes be unreliable due to poor quality or misinterpretation by the analyst.
However, critics of this random walk hypothesis often point towards investors like Warren Buffett and Cathie Wood, claiming that beating the market is possible.
It is pretty interesting to think about what role financial advisors and hedge funds would play in the economy if this theory is true!
Mean Reversion Pros and Cons
Like any trading strategy, mean reversion has pros and cons. The following section considers some of these.
The benefits are:
-
It allows investors to make profits even when markets are volatile. The mean reversion strategy fared well for many investors after the 2008 financial crisis that left markets in utter chaos.
-
Positions do not need to be held for too long. It typically requires a short holding period (2 - 10 days).
-
The high winning percentage makes it much easier to take the plunge than worrying too much about incurring losses.
-
Value investors like Warren Buffett also employ strategies comparable to mean reversion when deciding which stocks to invest in. Even Renaissance Capital’s Jim Simons used this technique to increase capital.
On the other hand, the disadvantages are:
-
This strategy does not fare well when markets go through periods of less volatility. Significant price fluctuations are essential.
-
A lot of times, this technique is employed when the market is in a bad state. It can be hard to purchase shares when the market is weak due to the fear of losing money.
-
According to the efficient market hypothesis, stock prices reflect all available information on that company. An investor can only beat the markets by attaining insider information.
-
It has been stated that several similar tools were examined using insufficient sample sizes regarding mean reversion indicators. As a result, their findings may not apply to the market as a whole.
Mean Reversion vs. Momentum Trading
When discussing mean reversion, it is also important to briefly talk about another trading technique known as momentum trading. Under this technique, instead of entering a trade to take a short or long position, the investor enters in the direction of the market’s trend.
This trading technique assumes that a bullish market isn’t just a market waiting to be corrected (i.e., return to its mean value). Instead, positive trends are worth following.
It involves entering a trade (buying stock) when it’s starting to take off and exiting (selling a stock) when it peaks. The graph below illustrates this.

Momentum trading attempts to track profitable positions for as long as it can. Hence, it requires the trader to maintain their position for a longer duration of time, as compared to other strategies.
Traders might wrongly act on misleading signals, incurring hefty losses before profits are made. For this reason, the strategy has a lower success rate. But as with all risky trades, it offers the investor a better return.
Despite this, both strategies can still be used in the same market. However, they must use unique means of differentiating a solid demand from a weak one.

Researched and authored by Rhea Bhatnagar | LinkedIn
Free Resources
To continue learning and advancing your career, check out these additional helpful WSO resources:


or Want to Sign up with your social account?