Parabolic SAR
A technical indicator to determine an asset's price direction and draw attention to when the price direction changes


What Is the Parabolic SAR Indicator?
Parabolic SAR is a technical indicator developed by J. Welles Wilder to determine an asset's price direction and draw attention to when the price direction changes.
It is also known as the "stop and reversal system," abbreviated as 'SAR.' It aims to identify changes in the price movement of the traded asset. It also provides entry and exit points to a trader.
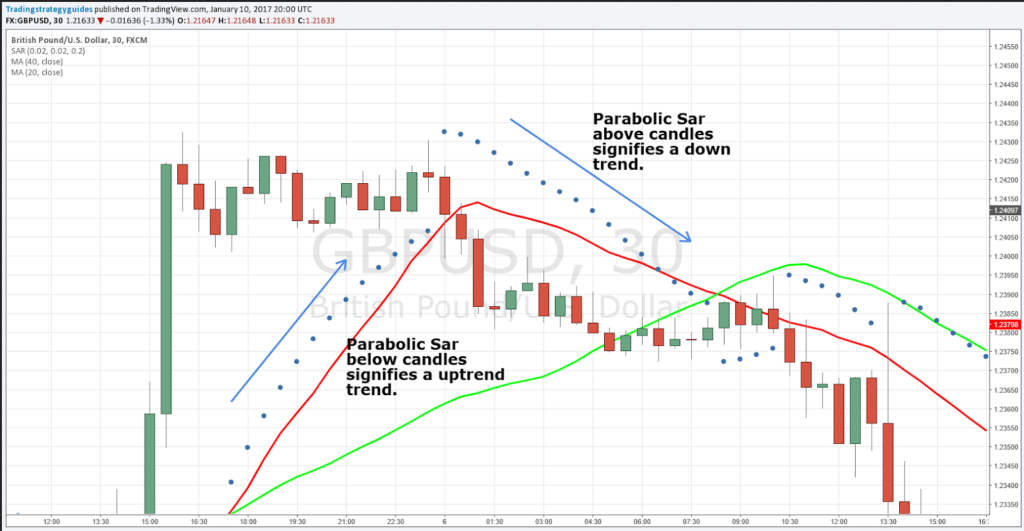
On a chart, The indicator appears as a series of dots above or below the graphs. A drop below the price is deemed a bullish signal, and a dot above it signals bearishness.
As in the figure, it is easily visible that when the dots are lined below the price candles, the candlesticks make an upward move, and they make a downward move when the sticks are above them.
It is a lagging indicator that reacts slowly to changes in market prices when the default parameters are used. On the other hand, it can still detect trends' turning points, including pullbacks and even the beginning of reversals.
Even though it is allegedly one of the easiest indicators to use, it won't be easy to distinguish the former from the latter while utilizing this indication.
- Developed by J. Welles Wilder, Parabolic SAR is a technical indicator that helps determine an asset's price direction and signals potential trend changes.
- The Parabolic SAR is derived using complex calculations involving the highest and lowest prices, as well as an acceleration factor (AF).
- Parabolic SAR excels in identifying trends and provides entry and exit signals, working best in robust, trending markets.
- Parabolic SAR can be particularly valuable in capturing significant price movements, even in the presence of external factors affecting stock prices.
Deriving the Parabolic SAR
J Welles Welder, also the developer of the RSI Index, was the developer of this helpful indicator. It uses the highest and lowest price and the acceleration factor to determine where the Sar dot will be displayed.
Its calculation and trading methods are closely related. We'll talk about that. On the price chart, this indicator displays Sar, or stop and reverse levels. The calculations are a little complex and involve two steps.
The Uptrend Parabolic Sar and the Downtrend Parabolic Sar are these two identically distinct portions.
For the calculation, we use the following:
Uptrend Parabolic Sar = Prior Sar + Prior AF (Prior EP – Prior Sar)
Downtrend Parabolic Sar = Prior Sar – Prior AF (Prior Sar – Prior EP)
Here,
- The EP refers to an extreme point in a trend (the highest point reached in a particular trend).
- AF means the acceleration factor is set to a value of 0.02(it is increased by 0.02 each time the EP is recorded, with a maximum of 0.20). Traders can choose the acceleration factor depending on the trading style or instrument being traded).
The results obtained from the calculations are portrayed in the chart as a dot either above or below the price sticks. And these dots help us determine what price action is working.
Parabolic SAR Uses
The benefit of using it is it helps us to identify trends. This indicator can quickly get good results in a robust, trending environment. Even if the trend movement is specified, it gives an exit signal when a price reversal is likely to occur.
This tool works best in a trending market. Also, this indicator makes a great pair with many other indicators for trading. For example, ADX, Moving Averages, or Stochastic can be used to complement Sar.
It also helps traders to gauge the stock's direction and place the stop loss.
For example, a sell signal is much more appealing when the price trades below the long-term averages.
The price below the long-term moving average suggests that sellers are in control, and at the same time if the Sar is also above the price signals, it creates a strong bearish signal for a trader.
Again when the price is above the moving average, and the Parabolic Sar is below the price level, it signals strong bullishness in the asset or stock.
Also, in this figure, we can see a trend reversal indication from Parabolic Sar. After getting an upswing the moment the stock finishes its Parabolic Sar signals the upcoming bullishness, whereas, for the MA lines, it wasn't so fast to signal the bearishness awaiting.
So a simple strategy can be applied selling when the dots start lining above the stock and buying when the dots start getting lined below the stock price.
How Parabolic SAR works
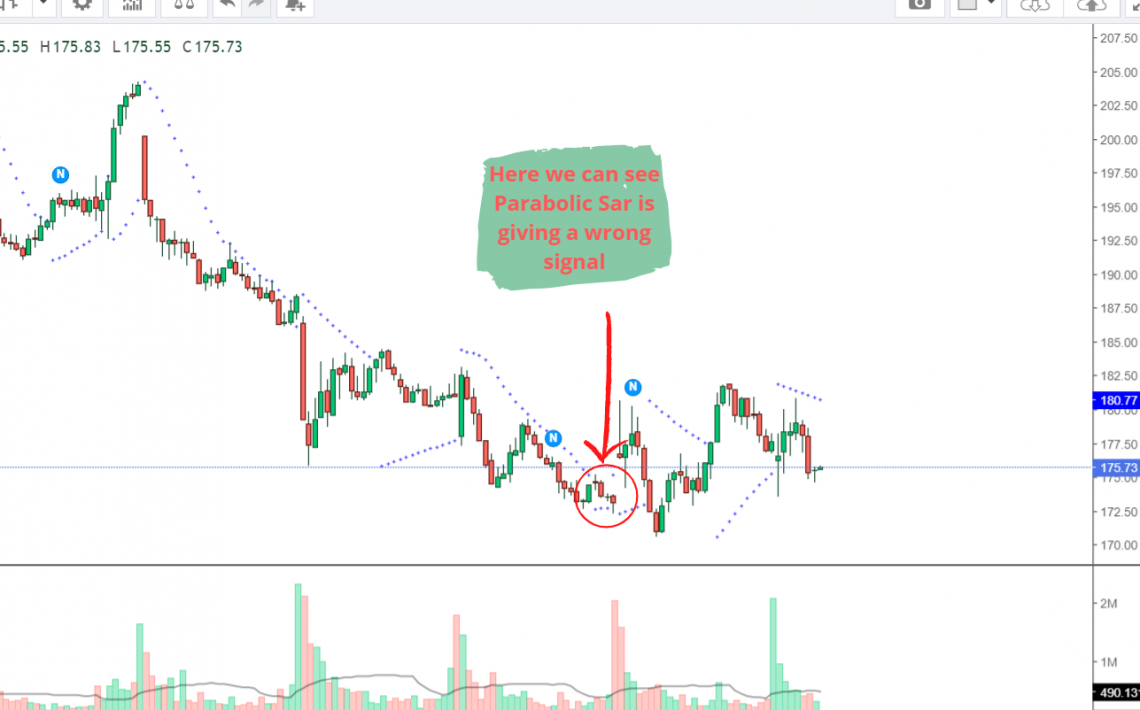
Let us discuss the topic with a real example. We take a Netflix($NFLX) 15 min chart on the 11th of may and apply parabolic Sar to the chart-

Here in this chart, we can see an incredible downtrend priorly signaled by the indicator before the gap happened the next day when the price was at a high of 205. The massive downtrend ended when the price reached around 182.
After that, the indicator signaled some bullishness by some solid green candles but again had bearish control. Thus, it's in a sideways market, and if we look closely, we can see wherever the volume bar was large, the indicator lacked its power of consistency.
In this chart, we can see multiple trading opportunities if we abide by the indicator. Although the price changes were mainly because of negative news about the company's financials, Parabolic Sar predicted the trend well.
Parabolic SAR Limitations
The advantage of using the parabolic Sar is that it can determine the trend and quantify the trend's strength or the change in direction by looking at how close the dot and candle are to one another.
When the market consolidates, it is susceptible to sending conflicting signals. When the market is trending, it is frequently necessary to have the experience to tell a pullback from a reversal.
Thus, besides bringing a useful trading indicator, it also has many limitations, making it less attractive to traders.
Some of the limitations of this indicator are put forth below:
- It provides false signals very often. The position of the dot changes with each price movement. Stocks are also volatile, so Parabolic Sar is very reactive to it.
- One significant price movement can suddenly change the dot's position at any time. At that point, the chart can help either move in the same direction as the sudden movement or continue its previous trend again when the reversal is not so strong.
- It creates a lot of trade opportunities. Being very reactive to price changes, the parabolic star gives signals many times in a single trading period. While setting targets using this indicator is complex, the solidity of the trade signal needs to be improved.
- The indicator does not help in the sideways market; it confuses the trader with false signals.
- It needs to provide information on the market volume, even if it may, to a certain extent, provide information on the momentum. And finally, although it can give a stop-loss and take-profit level, it must offer a precise entry level.
Even in the previous figure, we can see many false signals. Thus, even if the indicator gives an early signal, the strength of the signal can't be predetermined. Therefore, all these limitations have to be kept in mind while using this indicator.
Conclusion
In conclusion, it is a trend indicator and is better off when used in a trending market. It can be fruitful when used in a down or uptrend. However, in the sideways market, the use of such indicators turns vague.
If we consider the matter of false signals, every indicator has that tendency. Therefore, it is upon a trader's maturity to control his veins while trading.
To minimize the chances of false perils, the best way is to complement Parabolic Sar with indicators like MA, ADX, or Stochastic.
Having double or triple confirmation while trading is the best way to trade and manage risk. To help filter out some of the poor trade signals, only trade in the direction of the dominant trend.
Some other technical tools, such as the moving average, can aid in this regard.
To know more about this and other technical indicators that can make you a master of technical analysis, you may take our course on equity research.

Researched & Authored by Rishav Toshniwal
Free Resources
To continue learning and advancing your career, check out these additional helpful WSO resources:


or Want to Sign up with your social account?